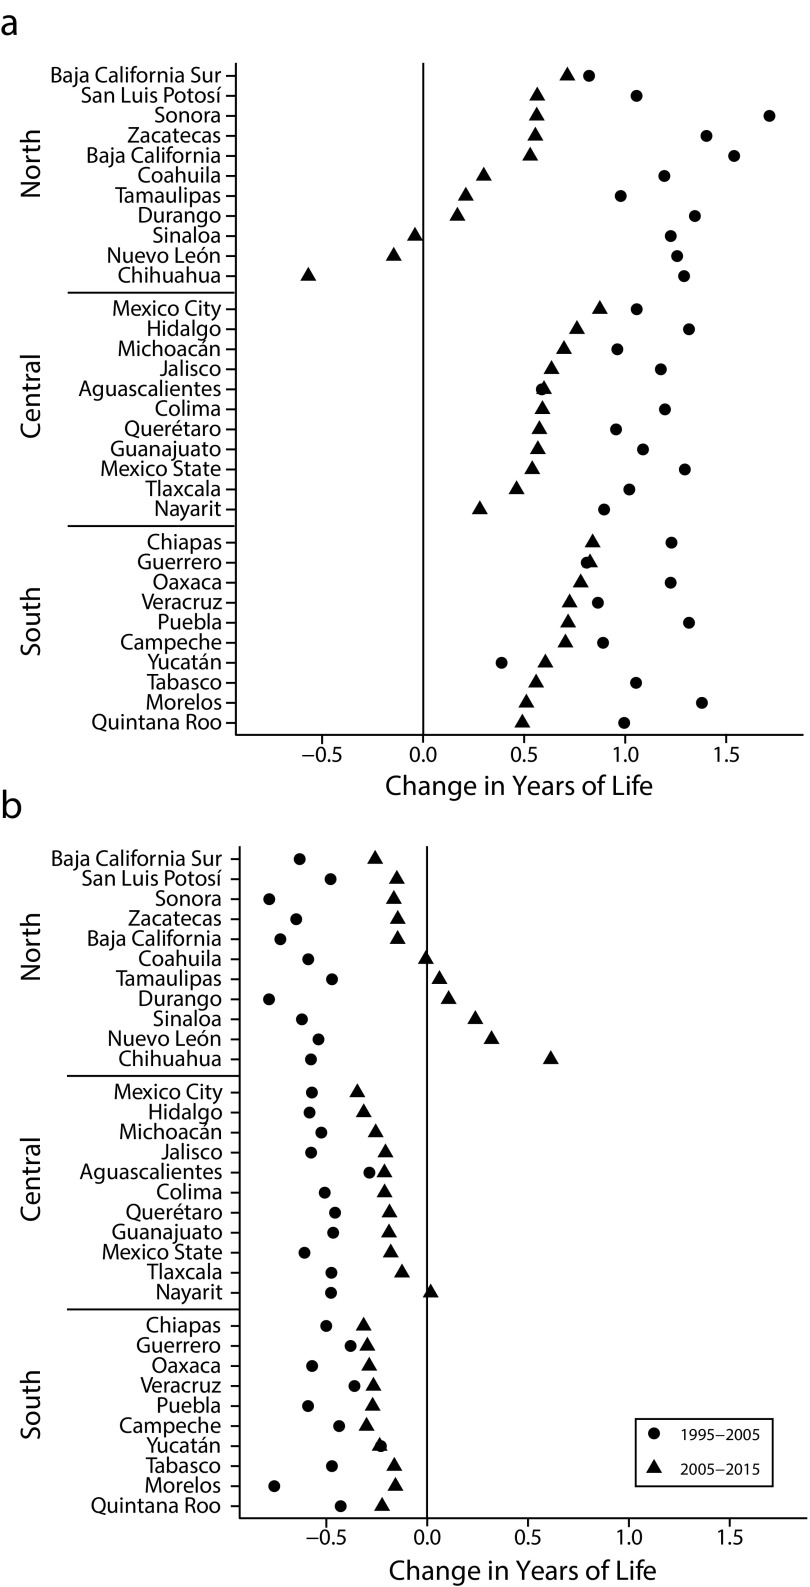
FIGURE 1—
Changes by State and Period in (a) Male Life Expectancy at Age 15 Years and (b) Male Life Span Inequality at Age 15 Years: Mexico, 1995–2005 and 2005–2015
Note. Life span inequality refers to life years lost because of death, which indicates heterogeneity in ages at death. A value of zero in life span inequality indicates that all cohort members die at the same age (i.e., no inequality in ages at death). This figure shows how life span inequality changed in 2 periods: positive values suggest increases in years of life lost and negative values correspond to reductions in life years lost because of death. Hence, the desirable association would be that, as life expectancy increases, life span inequality decreases. This figure shows each of the 32 Mexican states grouped in broad regions: north, central, and south. Within each region, states are ordered according to the magnitude in changes in life expectancy at age 15 years in the period 2005–2015.

