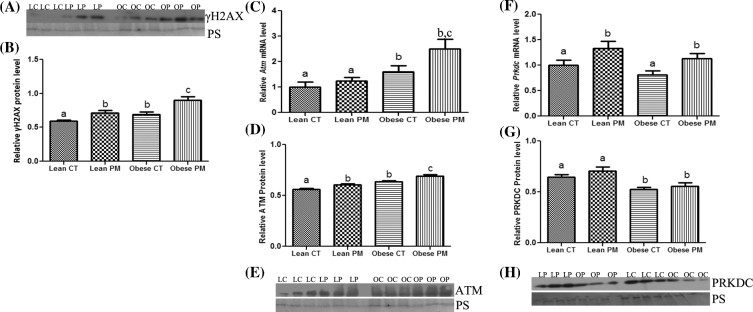
Figure 3.
Identification of PM-induced ovarian DNA DSB and induction of the DNA repair response in lean and obese females. Total ovarian RNA or protein were quantified using qPCR or Western blotting, respectively, to determine the effect of PM exposure on the abundance of (A, B) γH2AX protein, (C) Atm mRNA, (D, E) ATM protein, (F) Prkdc mRNA and (G, H) PRKDC protein in lean and obese ovaries. LC indicates lean control-treated; LP indicates lean PM-treated, OC indicated obese control-treated, and OP indicated obese PM-treated. For qPCR, each sample was normalized to Gapdh before quantification. For Western blotting, equal protein loading was confirmed by Ponceau S staining of membranes and protein level was normalized to Ponceau S densitometry values. Values are expressed as mean ± SE; n = 3. Different letters indicate P < 0.05.

