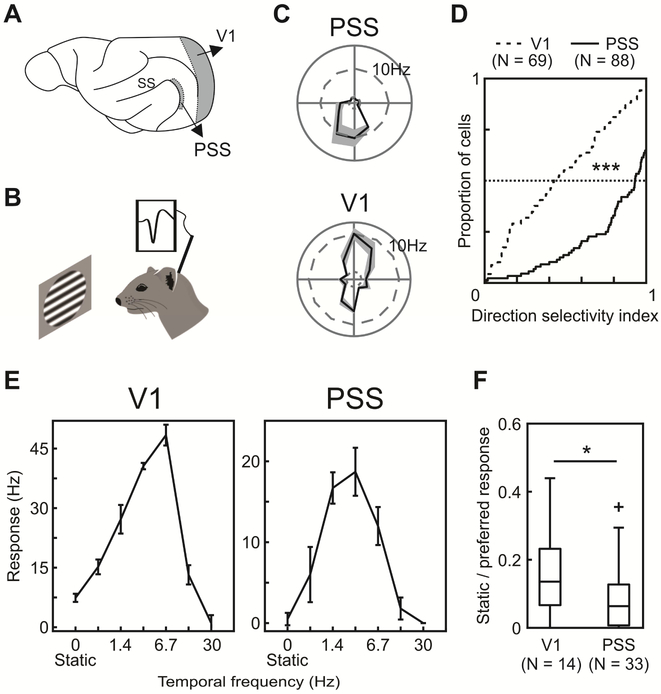
Figure 1: Basic PSS tuning properties indicate a role in motion processing.
(A) Sagittal view of the ferret brain indicating the location of PSS and V1 (ss: suprasylvian sulcus).
(B) Schematic of experimental setup. Neural responses to visual stimuli were recorded in anesthetized ferrets using tetrodes or multi-channel silicon probes.
(C) Direction tuning of an example PSS (top) and V1 neuron (bottom). The polar plot indicates mean firing rates to different directions (gray area: ± SEM).
(D) Cumulative DSI distributions for V1 and PSS.
(E) Temporal frequency tuning for a V1 neuron (left) and PSS neuron (right), measured using sinusoidal gratings drifting at different temporal frequencies (0 Hz indicates a static grating). Error bars represent ± SEM.
(F) Responses to static gratings relative to responses to preferred temporal frequencies. Boxplots indicate the spread of the observed response ratios in V1 and PSS. In this and all subsequent figures, the box indicates 25th, 50th and 75th percentiles. Whiskers indicate range, and crosses indicate outliers.
* = p < 0.05; *** = p < 0.001.

