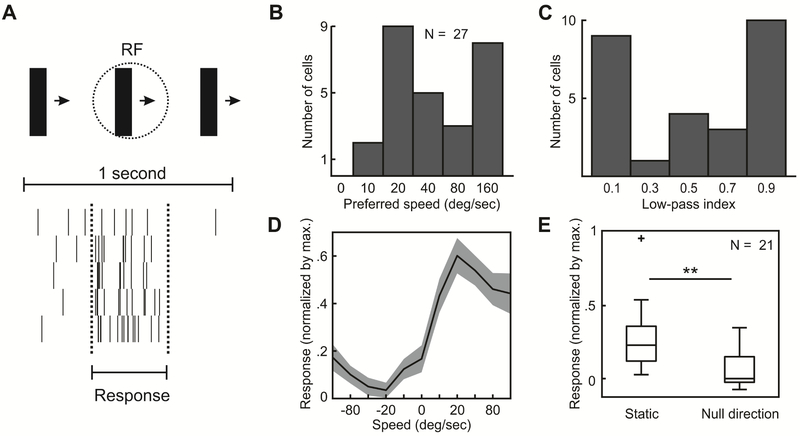
Figure 2: Speed tuning in PSS.
(A) Responses of an example PSS neuron to the drifting bar stimulus (illustrated on the top of the figure). Each row of the raster plot corresponds to one cycle of the bar drifting across the screen. The period during which the bar traverses the central 40 deg of the estimated receptive field is indicated by dashed lines. This time window was used to compute stimulus-evoked responses (see Methods).
(B) Distribution of preferred speeds.
(C) Distribution of low-pass indices for the same neurons as in (B).
(D) Average PSS speed tuning curve. To compute this curve, the response of each neuron was normalized by its maximum before averaging (same neurons as in (B)). Positive speeds indicate movement in the preferred direction, negative speeds movement in the null direction. 0 corresponds to a static bar. Note the decreased response to motion in the null direction relative to the static stimulus. Gray area: ± SEM.
(E) Comparison of responses to static bars and motion in the null direction at 40 deg/s. All responses were normalized by the maximum response per neuron.
** = p < 0.01.

