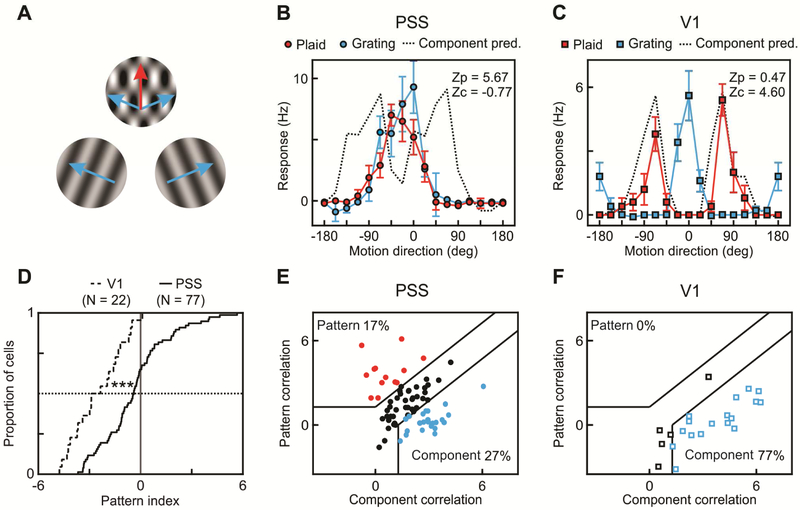
Figure 4: A subset of PSS neurons encodes pattern motion.
(A) Schematic representation of gratings and plaids used to investigate pattern motion responses in PSS and V1. Blue arrows indicate the directions of the component gratings, the red arrow the perceived plaid direction.
(B) Direction tuning curve of an example PSS pattern cell measured using plaids (red) and gratings (blue). Direction is relative to the neuron’s preferred direction for the grating. For plaids, direction indicates the perceived pattern direction (the components move at ±67.5 deg relative to this direction). For each neuron, the measured plaid tuning curve is compared to two predictions, one for idealized pattern responses (tuning curve identical to the grating tuning curve), one for idealized component responses (prediction indicated by dashed line). Z-transformed partial correlation indices ZP and ZC indicate how closely the measured plaid tuning curve resembles these predictions. Error bars: ± SEM.
(C) Plaid and grating direction tuning curves of an example V1 component cell. Same format as in (B).
(D) Cumulative pattern index distributions for V1 (dashed line) and PSS (solid line).
(E) Pattern versus component selectivity for PSS neurons. For each neuron, ZP is plotted against ZC. Black lines indicate the category boundaries used to classify cells into pattern, unclassified and component cells. Percentages indicate the portion of neurons falling into the different categories.
(F) Pattern versus component selectivity for V1, using the same format.
*** = p<0.001.

