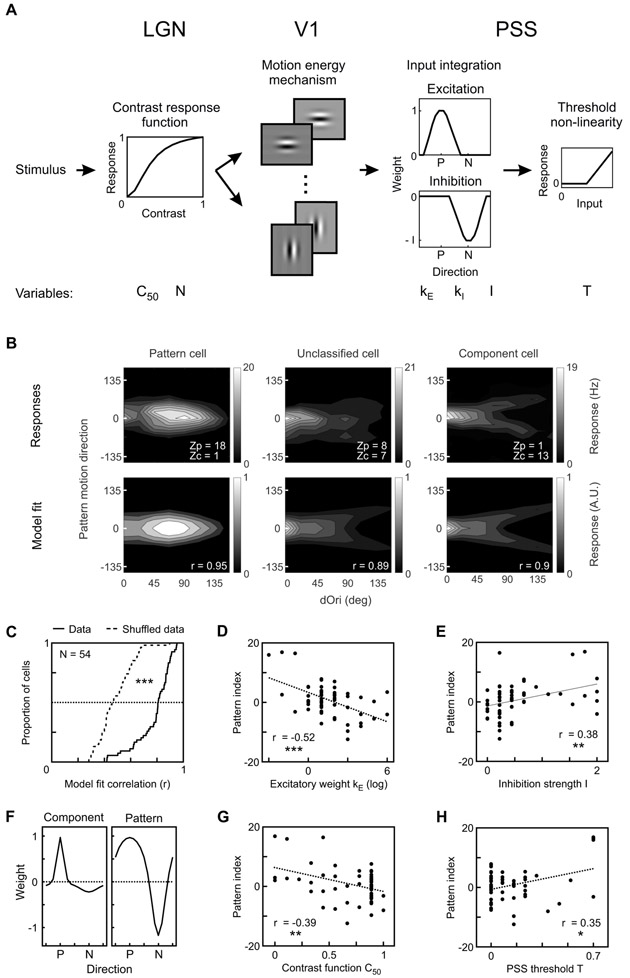
Figure 6: Motion representation in PSS can be explained by a multistage motion pathway model.
(A) Diagram of model used to explain PSS plaid responses (see Methods for details). Stimuli first passed through LGN spatial filters, which also served to scale responses according to contrast. The next stage was composed of 16 V1 motion-energy filters. Responses from the V1 stage were integrated in PSS using a combination of an excitatory and an inhibitory weight function (P – preferred direction; N – null direction). Finally, an output non-linearity was applied to the PSS responses. The model had 6 variables, which are listed below the stage to which they belong. All other parameters were fixed.
(B) Top: Responses of 3 example PSS neurons to the large plaid set (format as in Figure 5C). Bottom: Model fits, chosen to minimize the mean square error for each of the 3 cells. For each cell, r denotes the correlation coefficient between modeled and measured responses.
(C) Cumulative distribution of the correlation coefficient between modeled and measured PSS responses (solid line) or between modeled and shuffled responses from the same neurons (dashed line).
(D, E, G, H) Relationship between different model parameters and the pattern index. Correlation coefficients and their significance are indicated for each parameter.
(F) PSS weight function for the component cell (left) and pattern cell (right) shown in (B). The weight functions show the shape and relative contribution of the excitatory and inhibitory components determined for these cells by the model. Component cells have a sharp excitatory weight function with little inhibition, while pattern cells have a broad excitatory function combined with strong inhibition. P – preferred direction; N – null direction. Note that the amplitude of the excitatory weight function was fixed at 1.
* = p < 0.05; ** = p < 0.01; *** = p<0.001.

