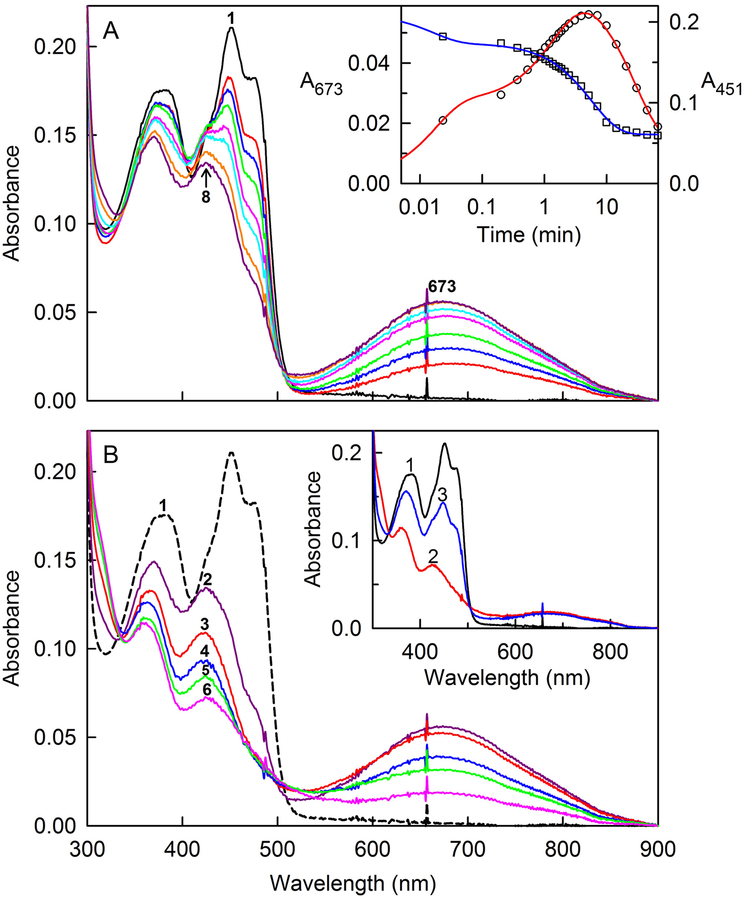
Figure 3.
Anaerobic reaction of SQOR with glutathione. The reaction of 18.1 μM SQOR with 8.26 mM glutathione was conducted at 7 °C in anaerobic 40 mM Tris-HCl buffer, pH 8.0, containing 40 mM NaCl and 0.009% DHPC. The black curve in each panel is the absorption spectrum of the starting oxidized enzyme. Panel A shows spectra recorded during formation of a long-wavelength absorbing intermediate. The red, blue, green, magenta, cyan, orange and purple curves were recorded 1.4, 12, 32, 82, 127, 234, and 310 s, respectively, after addition of glutathione. The inset shows plots of absorbance changes observed after glutathione addition at 673 and 451 nm, which are plotted according to the left- and right-hand axes, respectively. The red line was obtained by fitting a triple-exponential equation (y = Ae−k1t + Be−k2t + Ce−k3t + D) to the data (black open circles) recorded at 673 nm (R2 = 0.9963). The blue line was obtained by fitting a double-exponential equation (y = Ae−k1t + Be−k2t + C) to the data (black open squares) recorded at 451 nm (R2 = 0.9981). Panel B shows spectra recorded during the subsequent decay of the long-wavelength absorbing intermediate. Maximum formation of the intermediate is observed 310 s (5.17 min) after glutathione addition (curve 2). Curves 3, 4, 5, and 6 were recorded 9.9, 20.6, 30.2 and 66.2 min, respectively, after glutathione addition. The inset shows the reaction of glutathione-reduced SQOR with CoQ1. Oxidized SQOR (18.1 μM) (curve 1) was reduced (curve 2) by reaction with 8.26 mM glutathione at 7 °C for 66.2 min. Curve 3 was recorded 1.4 s after addition of 21.6 μM CoQ1. Because glutathione is present in excess, the oxidized enzyme underwent a second cycle of reduction, as judged by spectral changes observed upon further incubation (data not shown).

