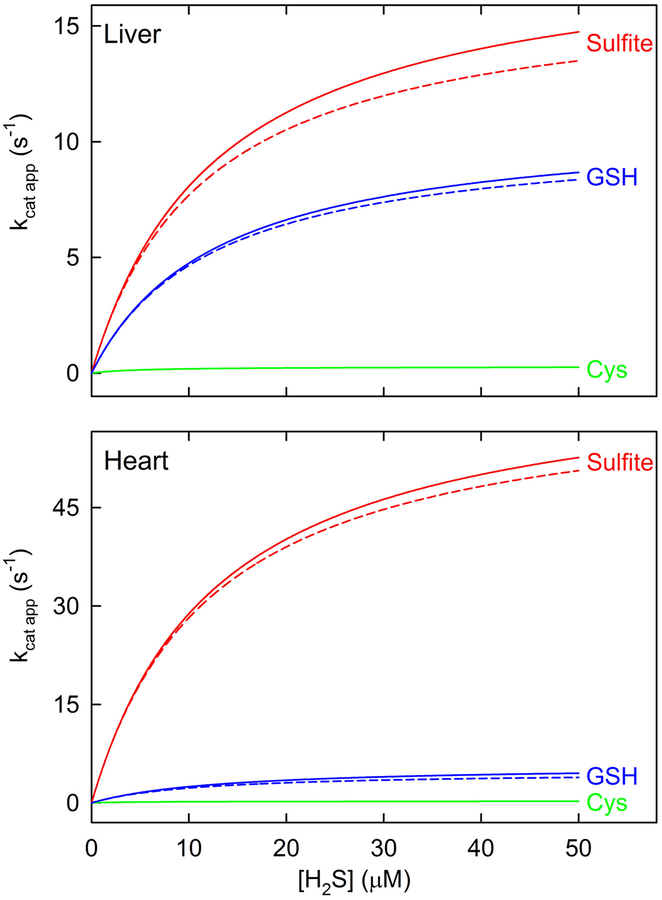
Figure 5.
Simulated rates of SQOR reactions with different sulfane sulfur acceptors at the acceptor concentrations observed in rat tissues. The simulated traces shown by the solid lines were generated using an equation for an ordered sequential mechanism (eq. 1a, A = H2S; B = acceptor), the steady-state kinetic parameters listed in Table 2, and the observed concentrations of sulfite, glutathione and cysteine in rat liver and heart (Table 1), as described in Experimental Procedures. The traces shown by the dashed lines simulate the SQOR reaction with sulfite as acceptor in the presence of glutathione (or with glutathione as acceptor in the presence of sulfite) and were generated by using an equation containing a competitive term (eq. 1b). The simulations for rat liver and heart are shown in the top and bottom panels, respectively.

