
Fig. 4. sAPP enhances short-term plasticity at Schaffer collateral synapses in a GABABR1a-dependent manner.
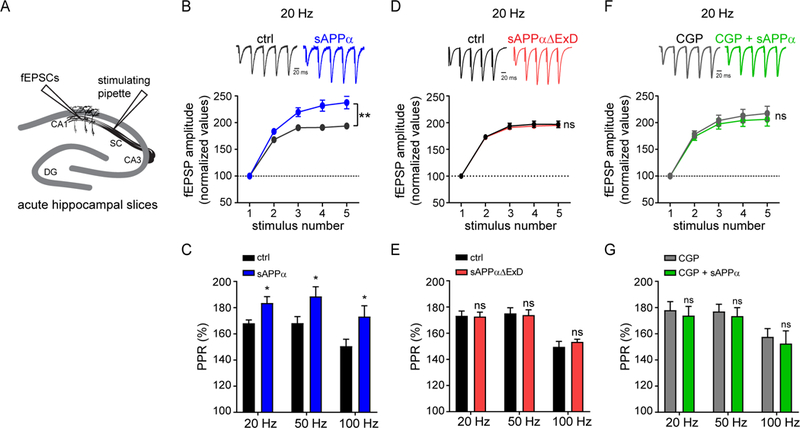
(A) Cartoon of fEPSC measurements in acute mouse hippocampal slices reported in B-G. (B) Representative traces (upper) and average fEPSP amplitude (lower) recorded at Schaffer collaterals (SC) in response to high-frequency burst stimulation at 20 Hz in mouse hippocampal slices incubated without (n = 12, N = 7) or with sAPPα (1 μM, Fc-tag enzymatically removed) (n = 10, N = 7). fEPSPs were normalized to the peak amplitude of the first response. (C) Paired-pulse ratios (PPR) for the first two pulses at each frequency (20 Hz, 50 Hz, and 100 Hz). (D) Same as B but in slices incubated without (n = 10, N = 4) or with sAPPαΔExD (1 μM, Fc-tag enzymatically removed, n = 9, N = 4). (E) Same as C. (F) Same as B but in slices incubated with CGP 54626 (CGP, 10μM) alone (n = 9, N =4) and slices incubated with CGP + sAPPα (n = 8, N = 4). (G) Same as C. The number of slices is defined as n, and the number of independent experiments or mice is defined as N. Graphs show means ± SEM. * P < 0.05, ** P < 0.1 *** P < 0.001. Two-way ANOVA analysis.