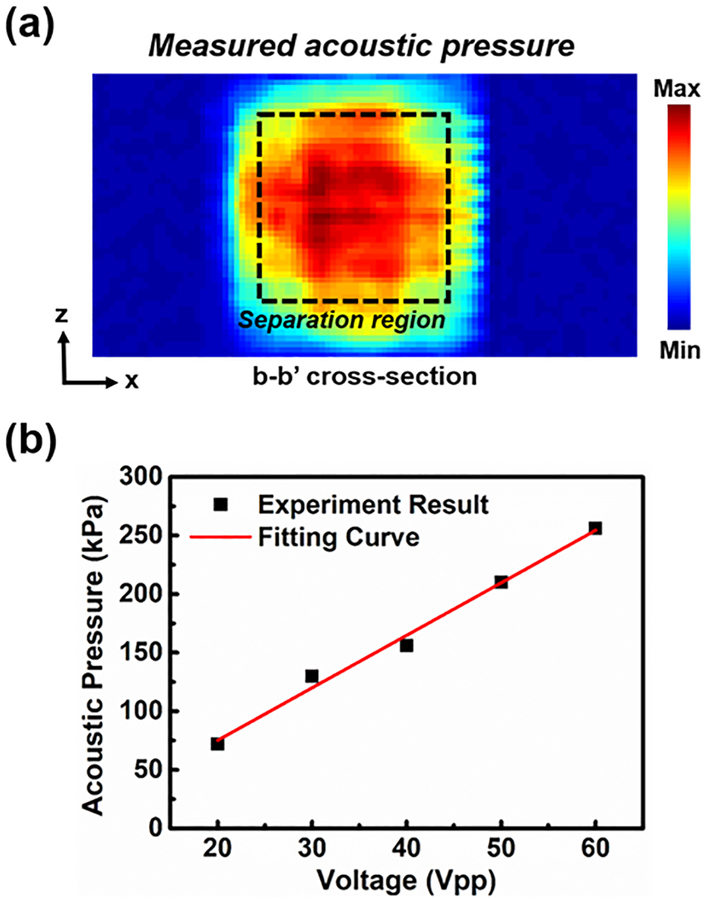
Figure 3.
(a) The measured acoustic field of the b-b’ cross-section. (b) The measured and fitted acoustic pressure as a function of the driving voltage. Each data point represents five independent measurements ± standard deviation from a hydrophone; however, because the hydrophone is stable and can reproducibly measure the acoustic pressure, the measured acoustic pressure barely changed among five independent measurements (error bars are smaller than data marker size).

