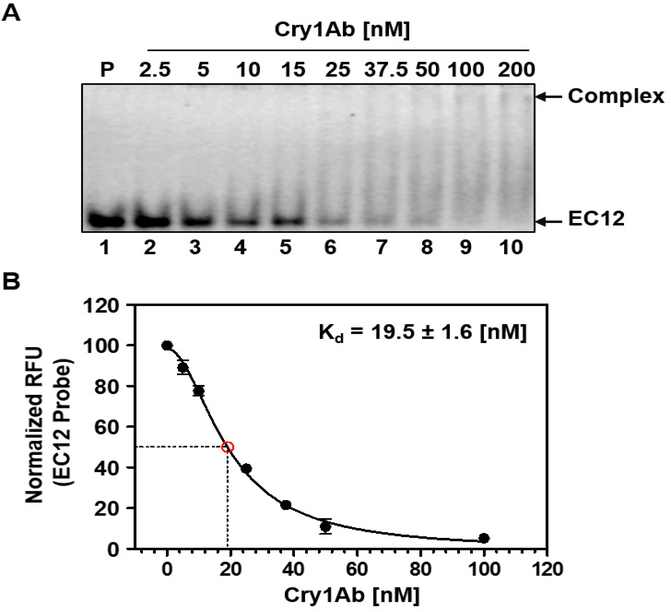
Figure 3:
High affinity interaction between EC12 and CrylAb. By using our recently published fluorescence-based EC12 probe (31), we determined the dissociation constant for EC12-Cry1Ab. The fluorescently labeled EC12 probe was kept at constant concentration. Cry1Ab was added to the various reactions at increasing concentrations. Samples were resolved on a native PAGE gel. The gel was scanned to obtain a fluorescent image. Results presented are based on an average of three independent analyses. (A) Representative fluorescent image of complex formation and concomitant decrease in intensity of the free EC12 probe. P: fluorescently labeled EC12 probe only (lane 1); lanes 2 to 10, EC12 probe (100 nM) mixed with Cry1Ab (2.5, 5, 10, 15, 25, 37.5, 50, 100 and 200 nM, respectively). Cry1Ab-EC12 complex and free EC12 probe are indicated by arrows on right. (B) Non-linear regression analysis of the binding of Cry1Ab and EC12. To determine the dissociation constant for Cry1Ab binding to EC12, a non-linear regression fit curve for the binding of the two molecules was obtained by measuring relative fluorescence units (RFU) of the free EC12 probe in the presence of Cry1Ab at different concentrations using Prism 5 by GraphPad.

