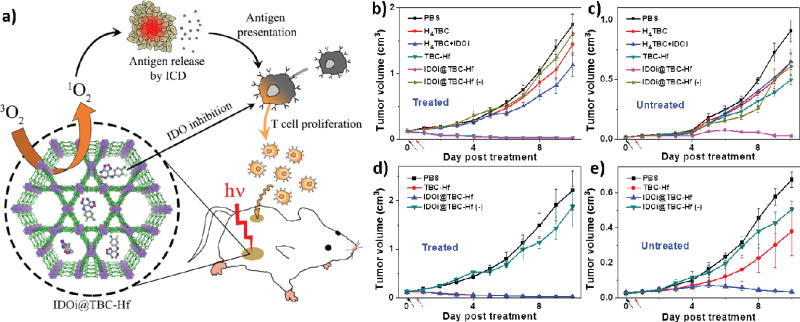
Fig. 7.
(a) Schematic presentation of combined PDT and immunotherapy by IDOi@TBC-Hf. Tumor inhibition curves for treated (b, d) and untreated (c, e) tumors of CT26 (b, c) or MC38 (d, e) models after PDT treatment. Black and red arrows refer to the time of injection and light irradiation, respectively. Reprinted with permission form ref. [129]. Copyright 2016 American Chemical Society.

