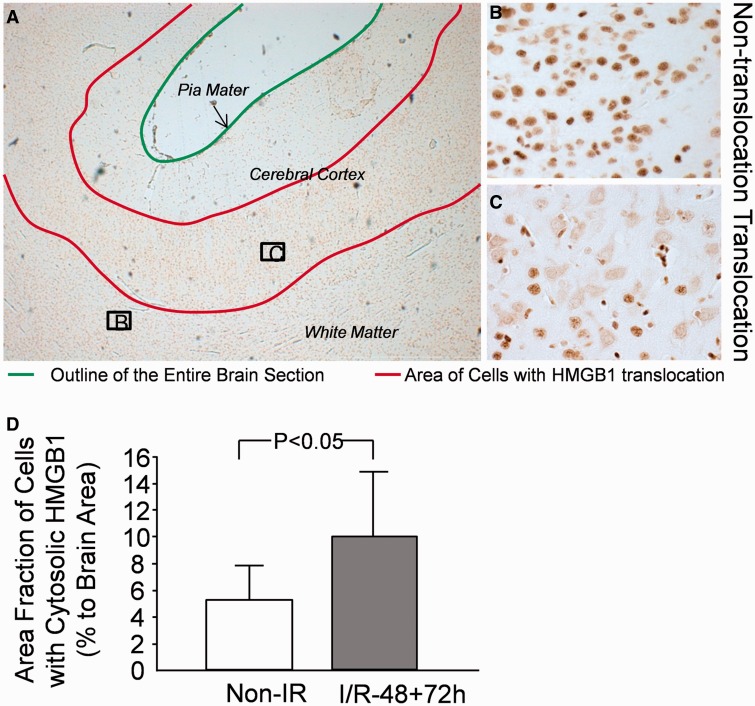
FIGURE 3.
Quantification of cells with cytoplasmic staining for HMGB1 in fetal sheep brain. (A) Immunohistochemical staining of HMGB1 in fetal sheep brain with ischemic injury (48 hours after ischemia). Green line indicates the brain surface; red lines indicate brain regions with cytoplasmic staining of HMGB1. (B) Cells with nuclear staining for HMGB1 contoured within green lines. (C) Cells with cytoplasmic staining for HMGB1 contoured in red lines. (D) Area fraction of cells with cytoplasmic staining for HMGB1 as a ratio of the total brain area; n = 3 in the control group without ischemia (Non-IR); n = 13 in the combined group with ischemia-reperfusion (I/R-48 + 72 h). Values are mean ± SD. *p < 0.05 vs. Non-IR.

