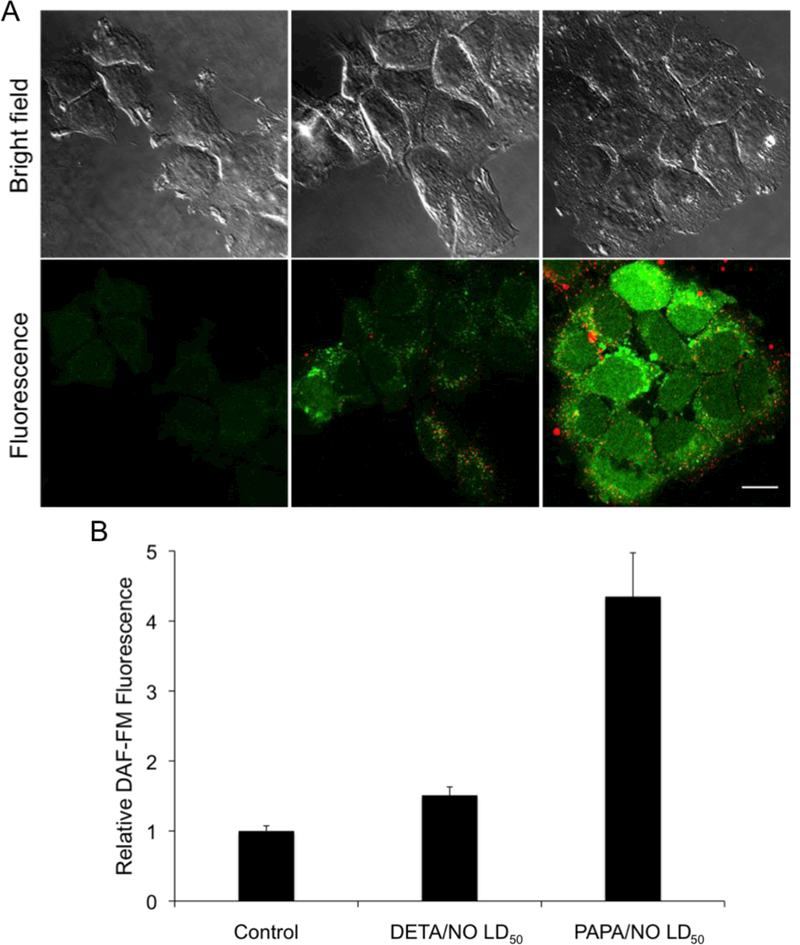
Figure 4.

(A) Confocal fluorescence images of MCF-7 cells incubated with DAF-FM (green) and treated with NO-releasing liposomes (red) for 2 h. Scale bar represents 15 μm. Column 1 is controls. Column 2 and 3 are cells exposed to the LD50 values of DETA/NO and PAPA/NO liposomes, respectively. By 2 h, DETA/NO and PAPA/NO liposomes released ~1 and 30% of their NO payloads, respectively. (B) Densitometric analysis of intracellular DAF-FM levels relative to untreated controls.
