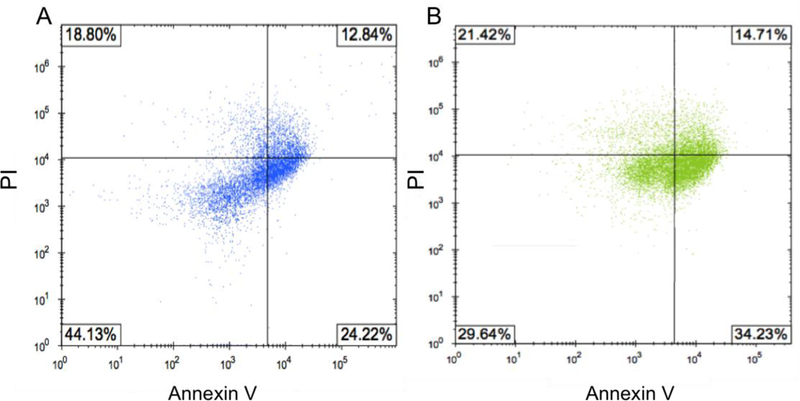
Figure 7.

Annexin V/PI quadrant plots for MCF-7 cells after 72 h exposure to (A) 16.2 μg/mL NO from PAPA/NO liposomes and (B) 0.75 μg/mL NO from DETA/NO liposomes (i.e., LD50 values). The percentages indicate the number of cells present in each quadrant. Units on axes are fluorescence intensities.
