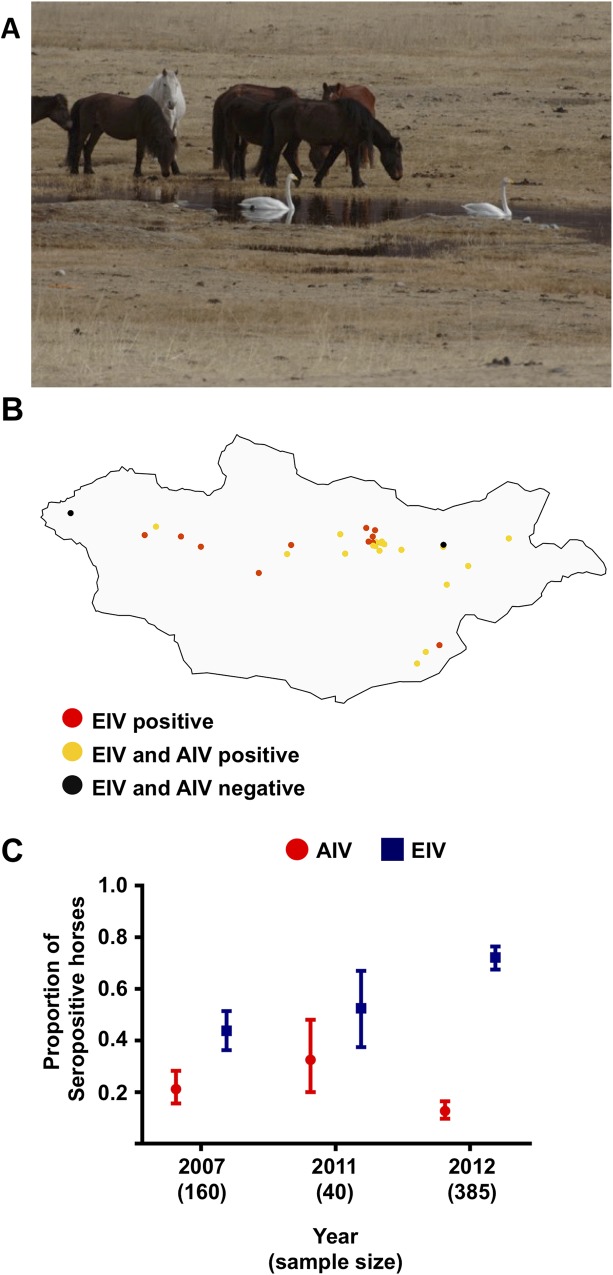
Fig 5.
A. Photograph showing the interface between horses and wild birds in Mongolia. B. Geographical distribution of sampling sites. Each circle represents a site where multiple horses were tested. Sites where horses were seropositive to EIV only are shown as red circles. Sites where horses were seropositive to both AIV and EIV are shown as yellow circles. Sites were horses were seronegative to both AIV and EIV are shown as black circles. C. Serological detection of EIV and AIV in horses in Mongolia. The graph shows the proportion and Agresti-Coull confidence interval of seropositive horses.

