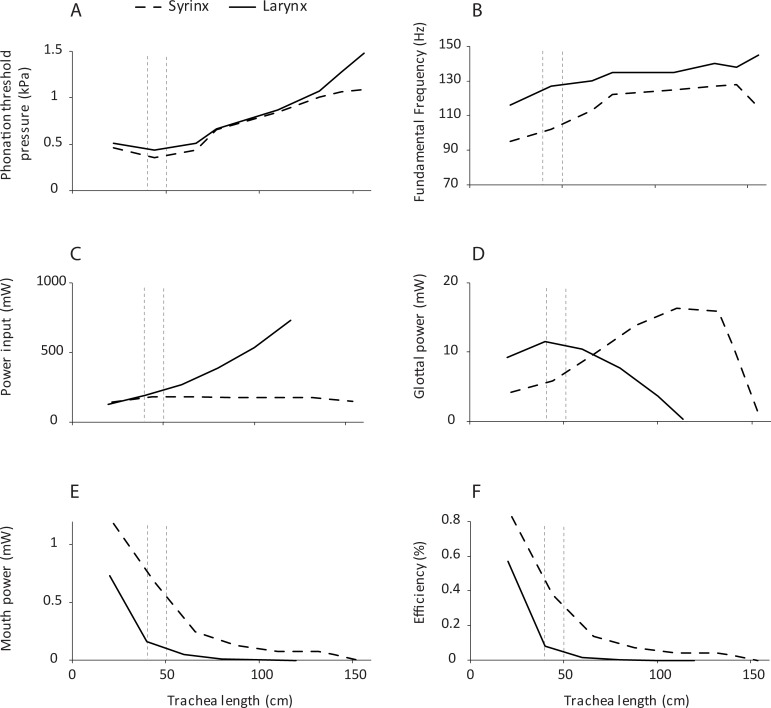
Fig 3. The effect of trachea length as studied by computational simulation.
Differences between the syrinx and larynx position in phonation are shown for threshold pressure (A), fundamental frequency (B), power input into trachea (C), glottal power (D), power at the mouth (E), and efficiency (F). Efficiency was computed as the mouth power divided by the input power. The two vertical dashed lines indicate the tracheal length range (40 cm ± 10 cm), which is most likely to correspond with a sound source of 1 cm vocal fold length used in this study (see Fig 2). Numerical data used in this figure is included in S1 Data.

