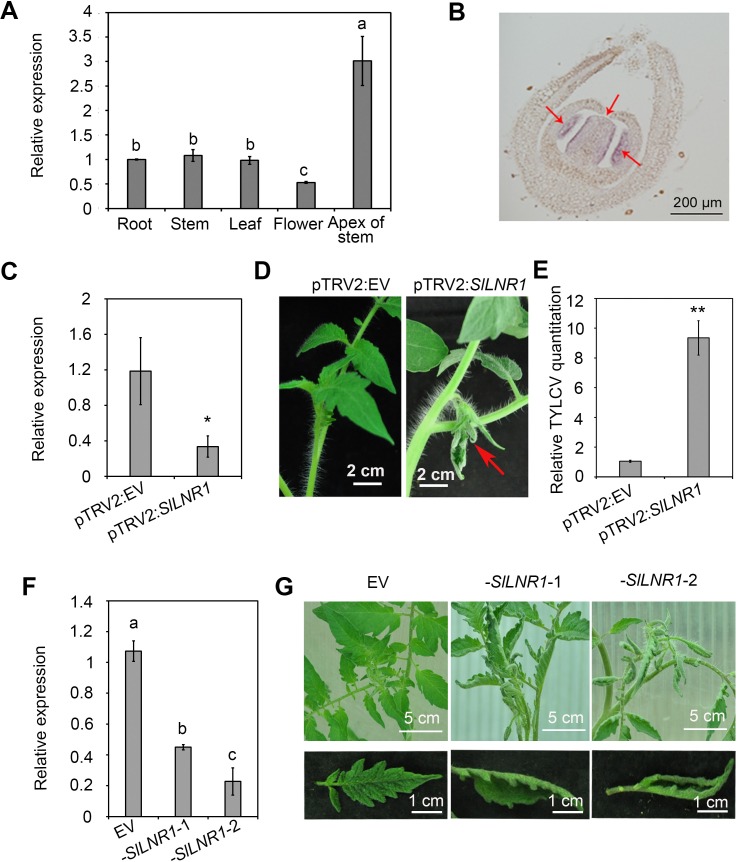
Fig 5. The SlLNR1 is important for tomato normal leaf development and resistance to TYLCV.
(A) qRT-PCR analysis of SlLNR1 expression in different tissues. Total RNA was isolated from the resistant tomato cultivars. Error bars represented SE of three biological replicates. Different letters on the bars designate statistically significant differences (P<0.05) according to Duncan’s multiple range test. (B) In situ hybridization of the SlLNR1 RNA. An 896-bp SlLNR1 fragment was used as the probe for in situ hybridization of SlLNR1 RNA (Bar = 200 μm). (C) The SlLNR1 was silenced in the resistant tomato. The relative expression of SlLNR1 was measured by qRT-PCR and calculated in relation to the EV inoculated samples at 15 dpi according to the ΔΔCt method. The tomato actin gene was set as reference gene. Error bars represented SE of three biological replicates and significant differences by Student’s t test (*, p<0.05; **, p<0.01). (D) Abnormal new-born leaves in the SlLNR1-silenced tomato plants. The photos were taken at 15 days after agroinfiltration of pTRV2:SlLNR1 on the tomato resistant cultivar. The arrow indicates the curling leaves. pTRV2 was used as a negative control and pTRV2:SlLNR1 indicates the silenced plants. (E) More TYLCV accumulation in the pTRV2:SlLNR1 plants. Total relative TYLCV genomic DNA amounts in pTRV2:SlLNR1 and EV inoculated plants were measured by qPCR analysis and calculated in relation to the EV inoculated samples according to the ΔΔCt method. The tomato actin gene was set as reference gene. Error bars represented SE of three biological replicates and significant differences by Student’s t test (*, p<0.05; **, p<0.01). (F) The expression of SlLNR1 was downregulated in the RNAi plants. SlLNR1 relative expressional levels were measured by qRT-PCR and and calculated in relation to the EV-transgenic plants according to the ΔΔCt method. The tomato actin gene was set as reference gene. Different letters on the bars designate statistically significant differences (P<0.05) according to Duncan’s multiple range test. (G) Abnormal phenotypes in the SlLNR1-silenced plants. The photos were taken at 2 months after germination. The -SlLNR-1/2 are SlLNR1 RNAi plants and EV indicate pCAMBIA2301 transgenic plants.

