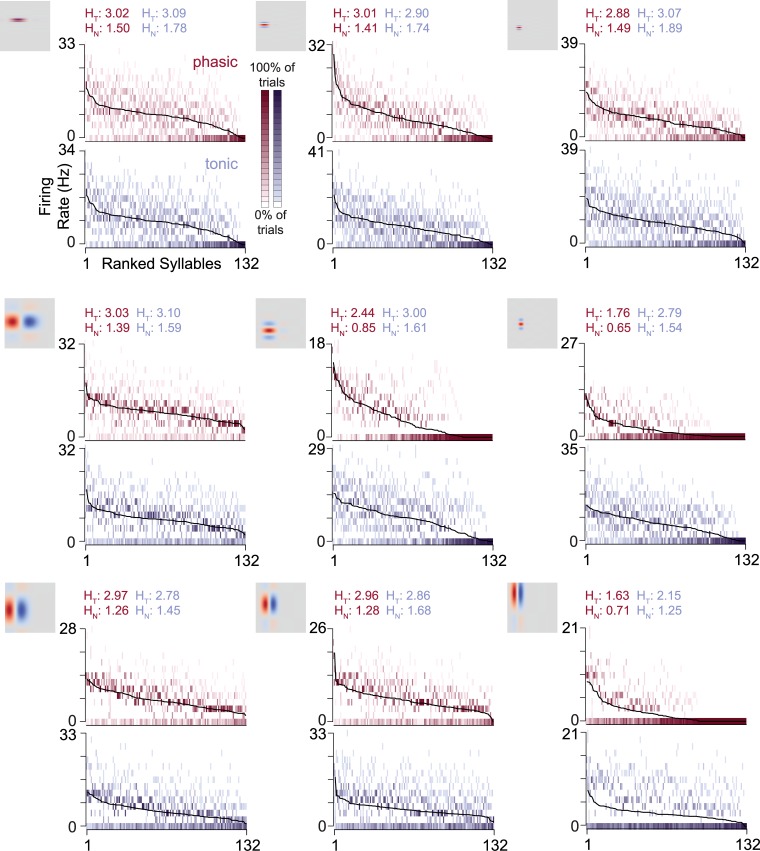
Fig 4. Phasic dynamics reduce trial-to-trial variability in spike rates.
Full response distributions for the nine example neurons shown previously. Response rates are calculated for each syllable and trial and discretized into 15 bins. The black lines indicate the average across trials; the spread of response rate bins around those lines show the trial-to-trial variability of the response rates. Darker colors indicate that response rates to the given syllable fall within that bin more frequently. Response distributions where the bins close to the mean line are dark and the bins further away are light, e.g. the phasic example in the top row, middle column, have low trial-to-trial variability. Distributions with darker scatter further away from the mean, such as the paired tonic example, have higher trial-to-trial variability. Overall, the phasic examples were less variable than their paired tonic models. Total entropy (HT) and noise entropy (HN) values are shown above each plot (phasic: red; tonic: blue).

