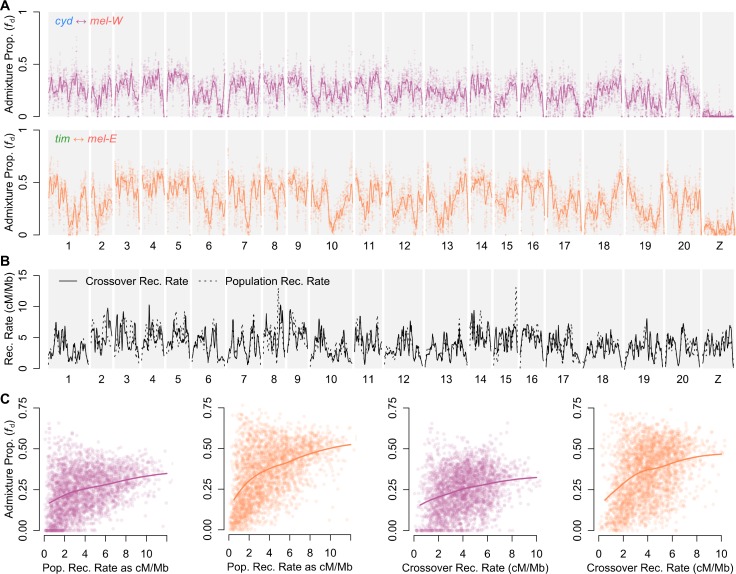
Fig 4. Admixture proportions are correlated with recombination rate.
(A) Estimated admixture proportions (fd) between cyd and mel-W (upper) and between tim and mel-E (lower) plotted across all 21 chromosomes in 100 kb windows, sliding in increments of 20 kb. A locally weighted average (loess span = 2 Mb) is included. Results shown are for population Sets 1 and 4 of S6 Fig. See S7 and S8 Figs for more detailed plots. (B) Recombination rate estimated from the crossover rate in linkage maps (solid line) and ρ averaged across the four populations considered and plotted as a locally weighted average (loess span = 2 Mb) (dashed line). See S9 Fig for a more detailed plot. (C) Admixture proportions for cyd and mel-W (first and third plot) and tim and mel-E (second and fourth plot) for nonoverlapping 100 kb windows plotted against ρ (first two plots) and crossover recombination rate (last two plots). Solid lines indicate the locally weighted average (loess span = 0.75). All plotted data deposited in the Dryad repository [55]. ρ, population recombination rate; cyd, H. cydno; mel-E, eastern races of mel; mel, H. melpomene; mel-W, western races of mel; tim, H. timareta.

