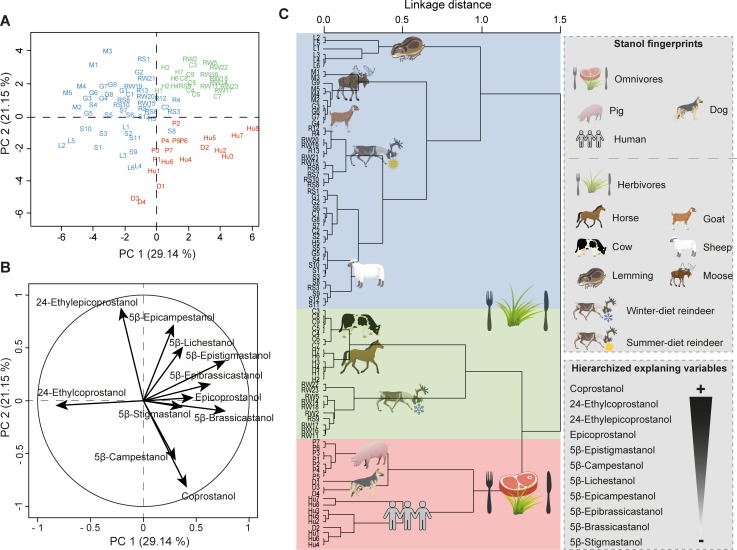
Fig 2. Mammal fingerprints.
(A) PCA score plot of 5β-stanol distributions in reindeer (R), lemming (L), goat (G), sheep (S), horse (H), moose (M), cattle (C), pig (P), dog (D) and human (Hu) faecal samples. Colours represent the main clusters obtained by HCPC (C). PC 1 and PC 2 represent respectively principal components 1 and 2; numbers in brackets show the variance explained by each PC. (B) PCA correlation circle. (C) HCPC dendrogram of all species fingerprints built on PCs from the PCA. The main variables/compounds responsible for the distinction between the main clusters are hierarchized (from the more important + to the less import -) according to S4 Table. More details of the PCA/HCPC models can be found in S4 Table and sample information is in S2 Table.

