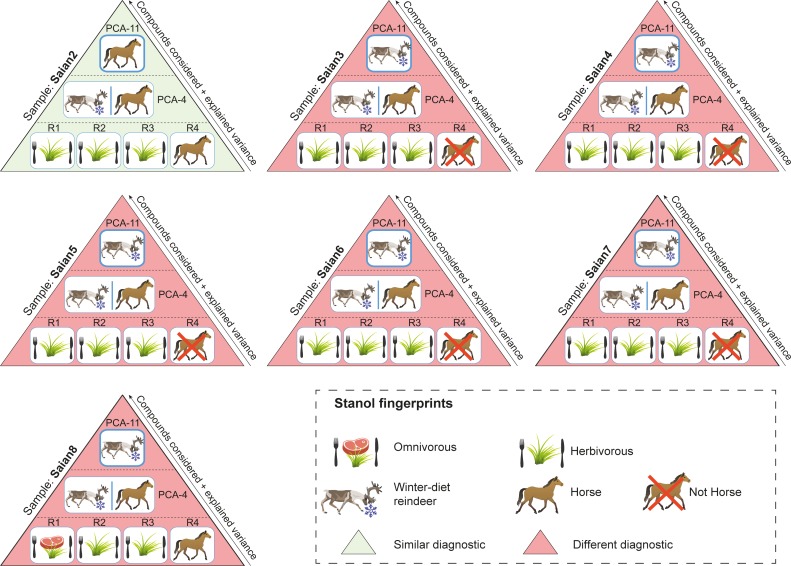
Fig 5. Summary comparison of diet and species identification using ratios and multivariate analyses for soil samples taken from the Tofa site (Sai͡an Mountains).
More details are presented in S7 Table. R1 refers to the ratio of distributions of coprostanol/(coprostanol + 24-ethylcoprostanol) used to discriminate the herbivore fingerprint from human (herbivore = 0.38 < R1 < 0.73 = human, [20]). R2 refers to the ratio of distributions of (coprostanol + epicoprostanol)/(24-ethylcoprostanol + 24-ethylepicoprostanol) used to identify the omnivore fingerprint (R2 > 1, [7]). R3 refers to the ratio of distributions of epicoprostanol/(cholestanol + coprostanol) used to discriminate the herbivore fingerprint from human (human = 0.01 < R3 < 0.1 = cattle and horse, [21]). R4 refers to the ratio of distributions of (24-ethylepicoprostanol/24-ethylcoprostanol) + (epicoprostanol/coprostanol) used to discriminate the horse fingerprint from other herbivores (No horse = 0.8 < R4 < 1.2 = horse, [10]). PCA-4 refers to the predictive PCA and its corresponding HCPC built with the distribution of the four main 5β-stanols (coprostanol, epicoprostanol, 24-ethylcoprostanol and 24-ethylepicoprostanol) in the human, dog, horse and reindeer reference samples from our database. PCA-11 refers to the predictive PCA and its corresponding HCPC built with the distribution of eleven 5β-stanols in the human, dog, horse and reindeer reference samples from our database. Reindeer and horses are herbivores so diagnostics between ratios and multivariate analyses can be compared.

