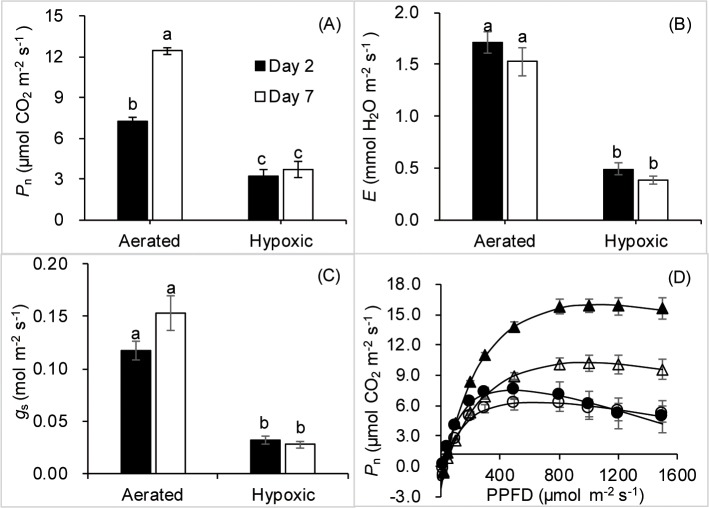
Fig 1.
Net photosynthesis (Pn, A), transpiration rates (E, B), stomatal conductance (gs, C) and photosynthetic light responses (D) of well-aerated tobacco plants and plants subjected to root hypoxia treatment for two days and one week. Means ± SE (n = 5 or 6 for Pn, E and gs. and n = 3 for photosynthetic light responses) are shown. Different letters above the bars indicate statistically significant differences determined by the Tukey’s test after one-way ANOVA (P ≤ 0.05). Aerated after two days (open triangles), hypoxia after two days (open circles), aerated after one week (black triangles), and hypoxia after one week (black circles).

