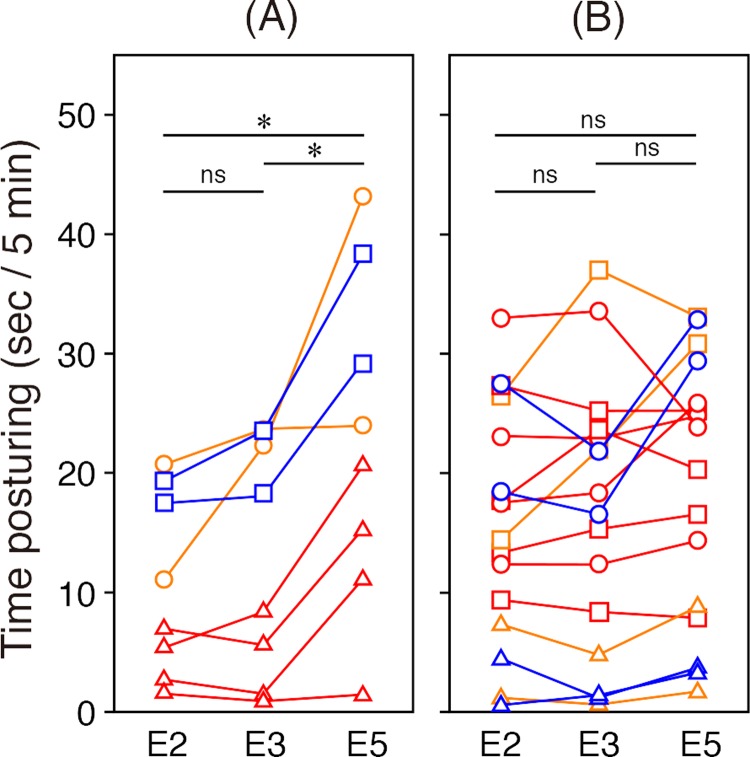
Fig 2. Mark locations and time spent in postures facilitating viewing of the marked site.
(A) Time spent in postures that reflect the marked location (i.e., the ‘correct’ side). Repeated-measures ANOVA, main effect of sequences: F = 12.09, P = 0.016; marked position: F = 19.06, P = 0.005; sequence × marked position: F = 0.70, P = 0.54. *P < 0.05 (n = 8). (B) Time spent in postures that reflect the unmarked locations. Repeated-measures ANOVA, sequence: F = 2.54, P = 0.12; marked position: F = 13.15, P = 0.0008; sequence × marked position: F = 0.99, P = 0.42. Underlying data for this figure can be found in S1 Data. ANOVA, analysis of variance; ns, not significant. Line colours: marked site on right side of head (orange), left side of head (blue), or throat (red). Node shapes: postures reflecting right side of head (circle), left side of head (square) or throat (triangle).

