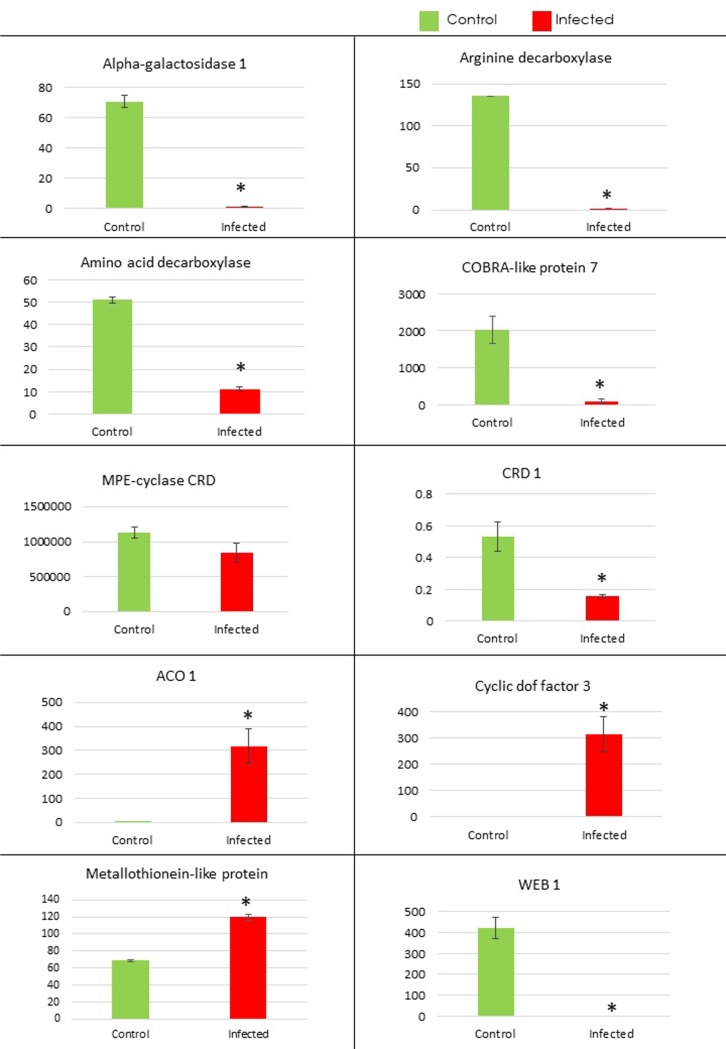
Fig 5. RT-qPCR Validation of transcriptomic data in MNH786 cultivar.
Relative expression levels of selected ten genes and 18S as an internal reference detected by RT-qPCR in control and symptomatic leaves. Error bars symbolized standard error of three biological replicates and * shows significance determined by Student’s t-test.

