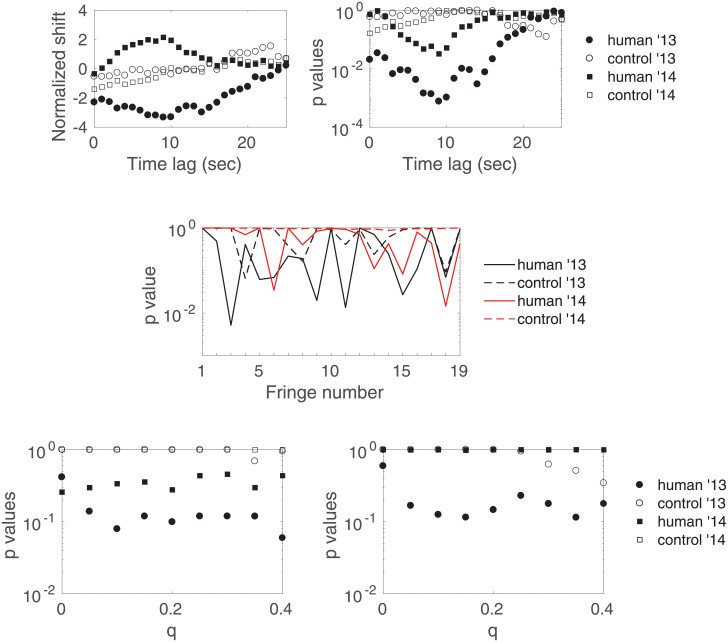
Fig 11. Test results using Eq 4 to define the fringe visibility.
(top) Normalized shifts and p-values pl versus the time lag for fringe number 9 (with q = 20%), (middle) p-value versus the fringe number (with q = 20%) and (bottom) p-value (left) and (right) versus the trimming intensity.

