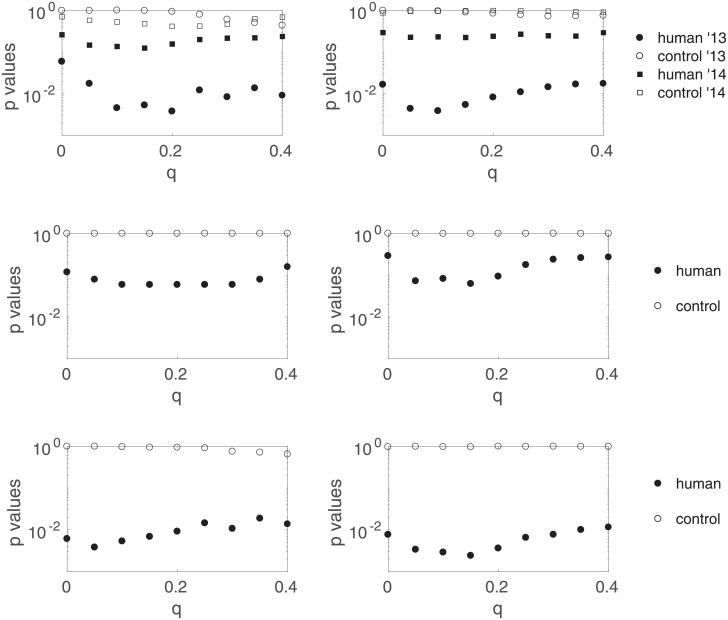
Fig 12. Results one would have obtained instead of Fig 9 in the following three scenarios.
(top) Scenario 1: a time lag of 9 seconds is chosen from the start, and both years are analyzed separately. (middle) Scenario 2: 26 different time lags are tested and then corrected for multiple comparisons, and the data from both years are combined after sign inversion for 2014. (bottom) Scenario 3: a time lag of 9 seconds is chosen from the start, and the data from both years are combined after sign inversion for 2014.

