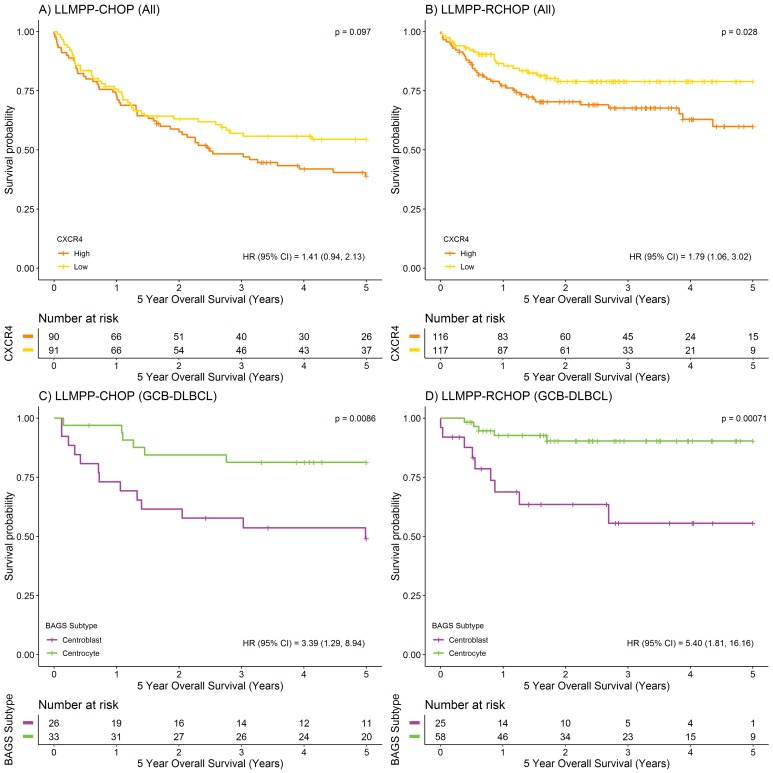
Figure 1. Prognostic value of CXCR4 expression and BAGS-defined subtypes displaying different levels of CXCR4 expression.
(A-B) Kaplan-Meier plots depicting 5-year OS for CHOP (n=181) and R-CHOP-treated (n=233) DLBCL patients stratified by CXCR4 expression level (217028_at), using the median as cut point. (C-D) Kaplan-Meier plots depicting 5-year OS for BAGS-defined CC and CB subtypes for CHOP (CC, n=33; CB, n=26) and R-CHOP-treated (CC, n=58; CB, n=25) GCB-DLBCL patients. For comparison of survival curves, the log-rank test was used. For hazard ratio (HR) estimation, a simple Cox’s proportional hazards regression model was used.

