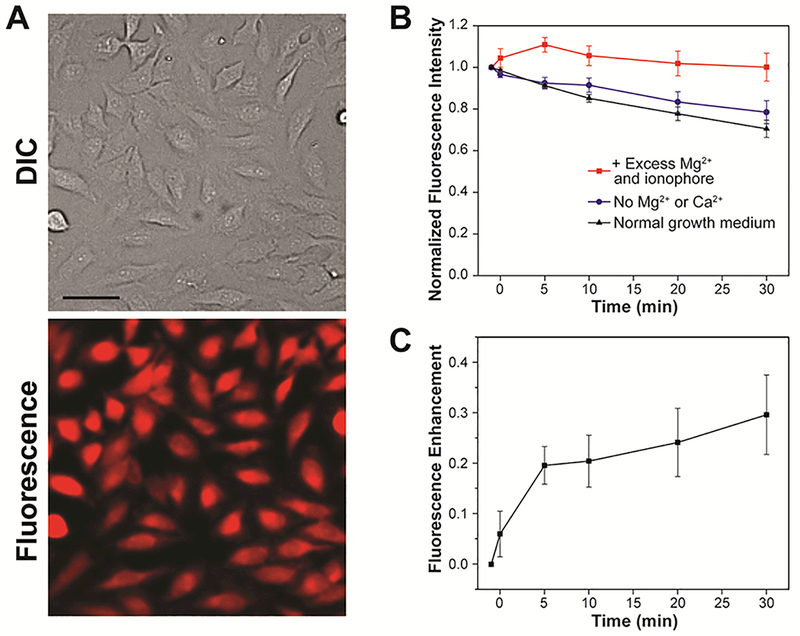
Figure 6.

(A) Representative widefield fluorescence microscopy imaging of endogenous Mg2+ with MagQ2 in live HeLa cells. Scale bar = 50 μm. (B) Normalized average fluorescence per cell in samples imaged in normal growth medium (black triangles), in medium depleted from Ca2+ and Mg2+ (blue circles), and under supplementation with exogenous Mg2+ and ionophore (red squares). Error bars represent the SD, N = 20. (C) Net fluorescence enhancement caused by Mg2+ influx to cells treated with exogenous Mg2+ and ionophore. Error bars represent the SD, N = 20.
