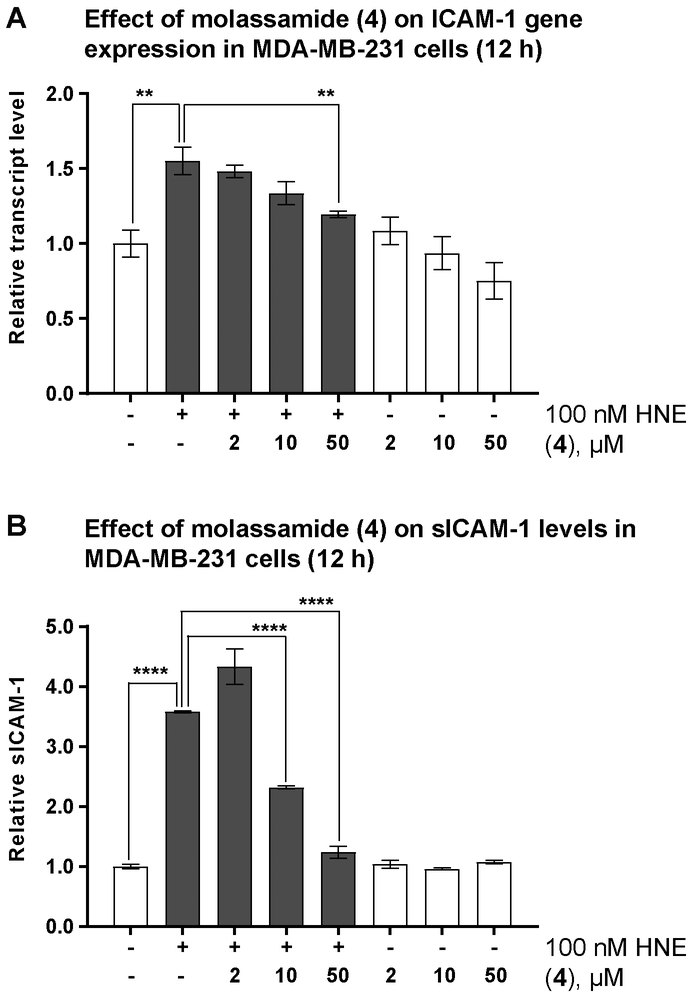
Figure 5.
The effects of elastase inhibition on ICAM-1gene expression and cleavage. A) Effects of molassamide (4) on ICAM-1 gene expression in the presence and absence of 100 nM HNE. B) Effects of molassamide (4) on the levels of sICAM-1 in the presence (grey bars) and absence (white bars) of 100 nM HNE. MDA-MB-231 cells seeded in 6-well plates, incubated overnight then starved for additional 24 h. The medium was then replaced with serum free DMEM containing different concentrations of 4 and 100 nM HNE. After 12 h, RNA was extracted and the medium was collected. The transcript levels and the levels of sICAM-1 were then assessed by RT-qPCR and ICAM-1 AlphaLisa, respectively. The asterisks denote significance of P < 0.05 relative to solvent control co-treated with HNE using two-tailed unpaired t test (** denotes P ≤ 0.01, *** denotes P ≤ 0.001, and **** denotes P ≤ 0.0001).

