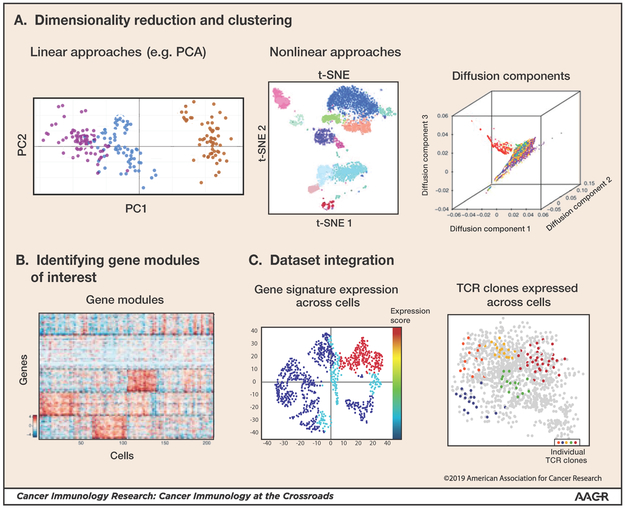
Figure 1: Single-cell data analysis methods.
Several analysis steps are taken to generate an initial characterization of single-cell data (following or in parallel to normalization of technical noise and artifacts). (A) Various linear (e.g. PCA; principle component analysis) and non-linear (e.g. tSNE; t distributed stochastic neighborhood embedding and diffusion maps) dimensionality reduction methods can be used for identifying the main discriminants of the data of interest and for visualization. Clustering of cells by their transcriptomes can identify sets of cells that comprise units within the system. (Diffusion component illustration based on [37]) (B) Gene sets that co-vary across the data identify gene modules of interest with respect to heterogeneity and potential functionality of the cell subpopulations within a sample (figure based on [50]). (C) Integration of additional data types and sources can enable broader insights into the scRNA-seq dataset. Shown are two examples. Left: Scoring single-cells for the extent to which they express pre-defined gene signatures to infer function and characteristics of populations identified. Right: Integration of single-cell TCR information generated in parallel to the scRNA-seq data (figure based on [12]).

