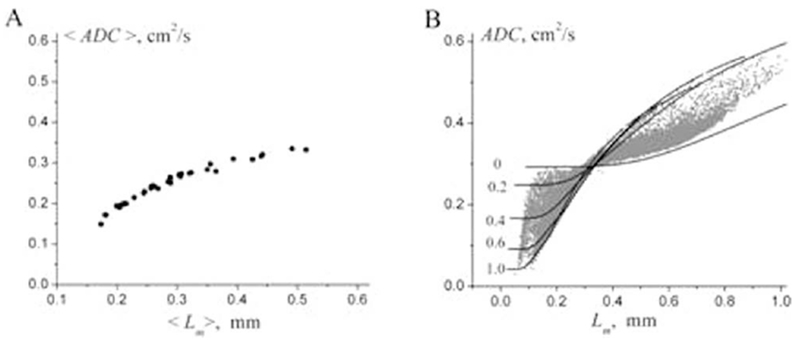
FIG. 14.

ADC versus Lm found for 30 subjects from study (104) (adapted from Ref. 189). a: The average (over each subject) values of the parameters ADC and Lm. b: ADC and Lm calculated on a pixel-by-pixel basis (grey symbols). The lines represent the dependence of ADC as a function of Lm, theoretically calculated at fixed values of the ratio h/R (given by numbers near the lines). Importantly, each value of Lm can be associated with numerous values of ADC, and vice versa.
