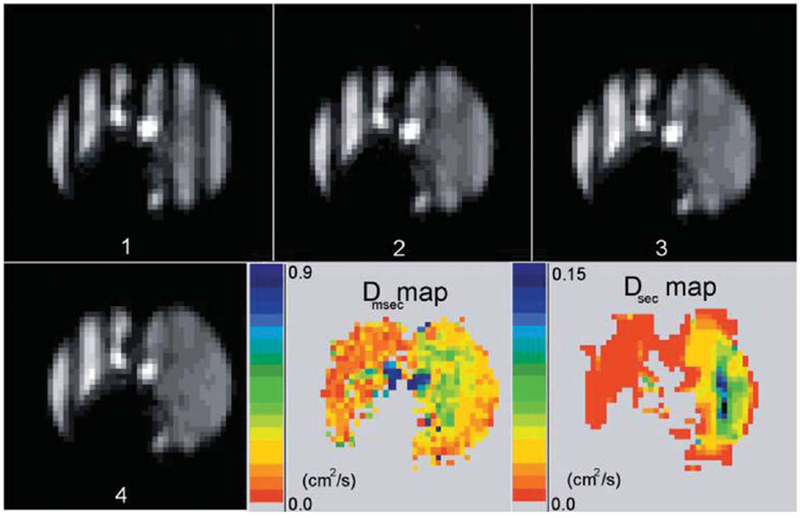
FIG. 15.

Time sequence of tagged images in dog with emphysema in the right lung only (right side of each image) (adapted from Ref. 116). The images have a tagging wavelength of 3 cm and were acquired 0 to 4.1 s after tagging, in equal increments of 1.36 s. The images presented are all from the same slice, out of a total of 10 slices. The LRADC map at lower right is calculated from the decay rate of the fractional modulation on a pixel-by-pixel basis, and shows a substantial difference in LRADC between the two lungs. The fast diffusion is evident from the rapid disappearance of the modulation in the right lung. An ADC map of short-range diffusion is also shown for comparison; note the different scales for LRADC and ADC.
