
FIG. 5.
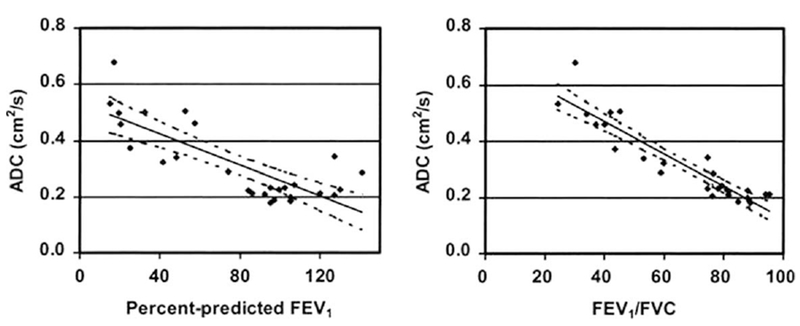
Scatter plots depict the relationship between the ADC parameters and spirometric indexes obtained from 16 healthy volunteers and 11 patients with emphysema (adapted from Ref. 83). The 95 % CIs for the regressions are shown as dotted lines. For all subjects, the mean ADCs correlated with the percentage of predicted FEV1 (r =−0.797, P < 0.001) (left) and FEV1/FVC (r = −0.930, P < 0.001) (right).