
FIG. 8.
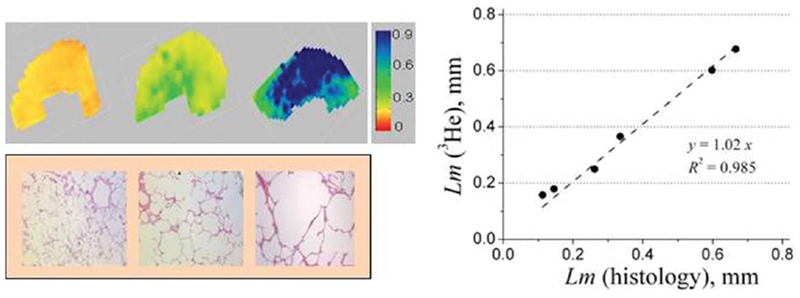
Upper row: examples of the Lm (in mm) maps obtained from normal human lung (left) and lungs with different stages of emphysema (mild–middle and severe–right) (adapted from Ref. 146). Lower row: examples of histological slices obtained from the same lungs as above. Right panel: plot of mean linear intercept obtained by means of lung morphometry with hyperpolarized 3He diffusion MRI versus direct measurement. Each point represents one lung. Lm (3He) is median calculated across entire lung; Lm (histology) is median calculated across all lung specimens corresponding to this lung.