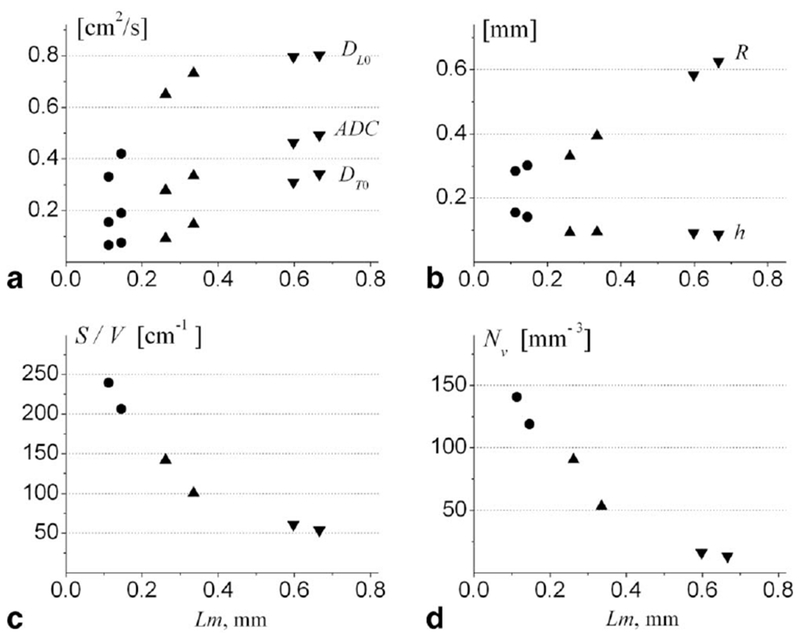
FIG. 9.

Summary of data obtained for six human lung specimens. a: DL0, DT0, and ADC (in cm2/s); b: R and h (in mm); c: S/V (in cm−1); d: Nv (in mm−3) (adapted from Ref. 146). Markers (•) represent two control healthy lungs, markers (▴)–two lungs with mild emphysema, markers (▾)−two lungs with severe emphysema. Each data point is a median calculated across all imaging voxels for a given lung specimen. Horizontal axis is the mean Lm obtained from direct histological measurements on the same lungs.
