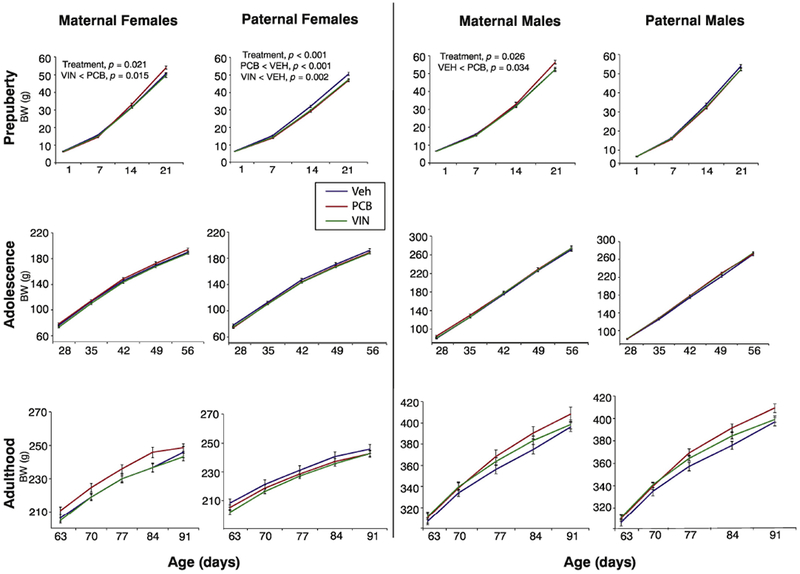
Fig. 3.

Body weight (g) of the F3 generation females and males is shown in each sex over three life phases: prepuberty (P1-21), adolescence (P28-56), and adulthood (P63-P91). Significant differences and p-values from repeated-measures ANOVAs are shown; differences indicated are for the entire time series. Data are mean ± SEM.
