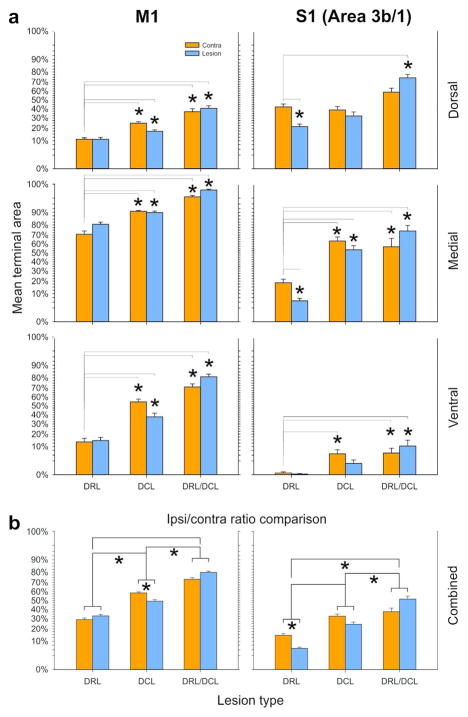
Figure 7.
Terminal bouton territory histograms for S1 and M1 CSTs. a Each section was divided into Dorsal, Medial, and Ventral zones, and into contralateral and ipsilateral subregions. The contralateral side in the DRL lesion group (n=2) was used as the control since this did not differ from normal control animals, or published accounts. Asterisks indicate means that differed significantly from their respective controls. Significance was defined as P<0.0167 (Bonferonni corrected), since we controlled for multiple comparisons. Lines are only shown where comparisons were statistically significant. Data are plotted as Repeated Measures LSM +/− SE, thus controlling for differences between monkeys and for systematic differences along the cord. Data are angular transformed (see Methods for details). b shows summary histograms that pooled data for dorsal, medial, and ventral subdivisions to determine differences in the sprouting response relative to the lesion. Comparisons were made between the ipsi- and contralateral sides of the spinal cord, both within and across lesion groups. Findings were always the same for monkeys within each lesion group. Asterisks indicate statistical significance. Note that following a DCL alone (n=2), more extensive terminal labeling (sprouting) was observed on the contralateral side of the cord, but this was reversed following the combined DRL/DCL (n=2).

