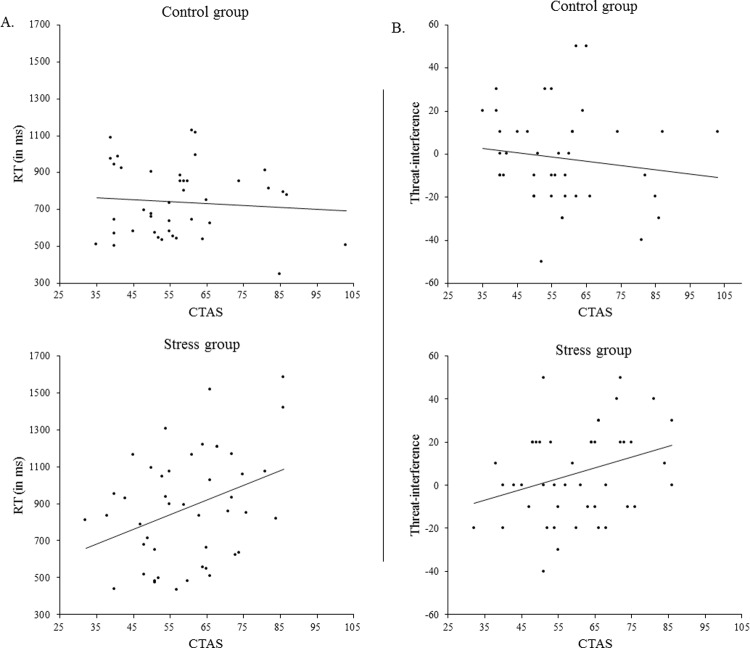
Fig 4. Scatterplots for the relationship between CTAS and n-back performance in the control and stress groups.
A) Scatterplots for the relationship between CTAS and RT during the blank condition in the control (upper panel; r = -.08, p = .618) and the stress group (lower panel; r = .35, p = .02). B) Scatterplots for the relationship between CTAS and threat-interference during the high load condition as assessed by accuracy (accuracy scores during neutral condition. minus accuracy scores during negative evaluation condition in %) in the control (upper panel; r = -.138, p = .388) and the stress group (lower panel; r = .312, p = .037).

