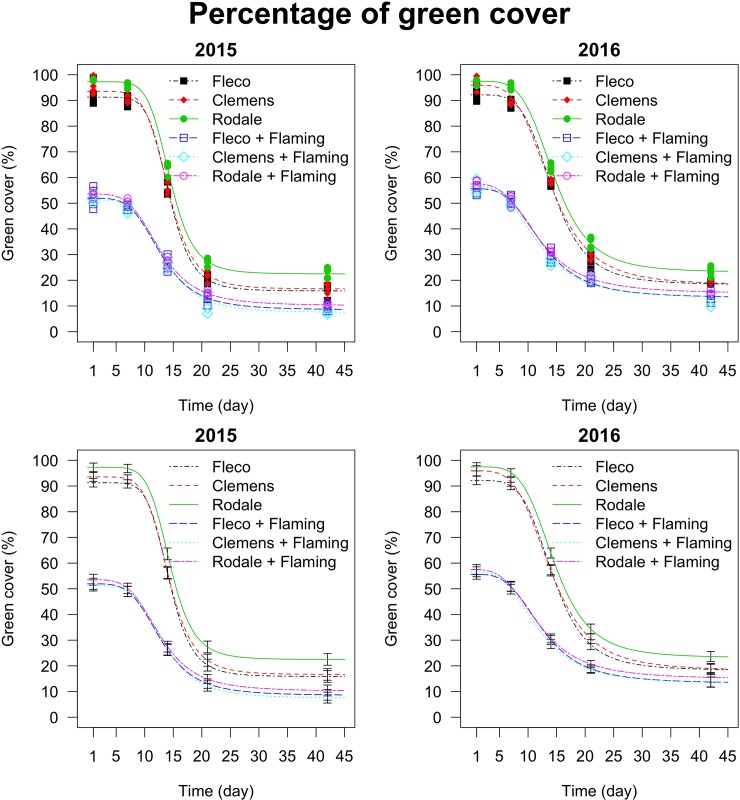
Fig 7. Percentage of green cover as affected by time (days after termination) and by the interaction between the type of roller (Fleco, Clemens and Rodale) and the flaming factor (if applied or not), in 2015 and 2016 growing seasons.
All the data points and the model-based standard errors are reported, respectively, in the top and bottom graphs. The parameters of the curves (Eq 1) are reported in Table 2. Degrees of freedom: 96. The percentage of green cover before the termination was 100% in all plots.

