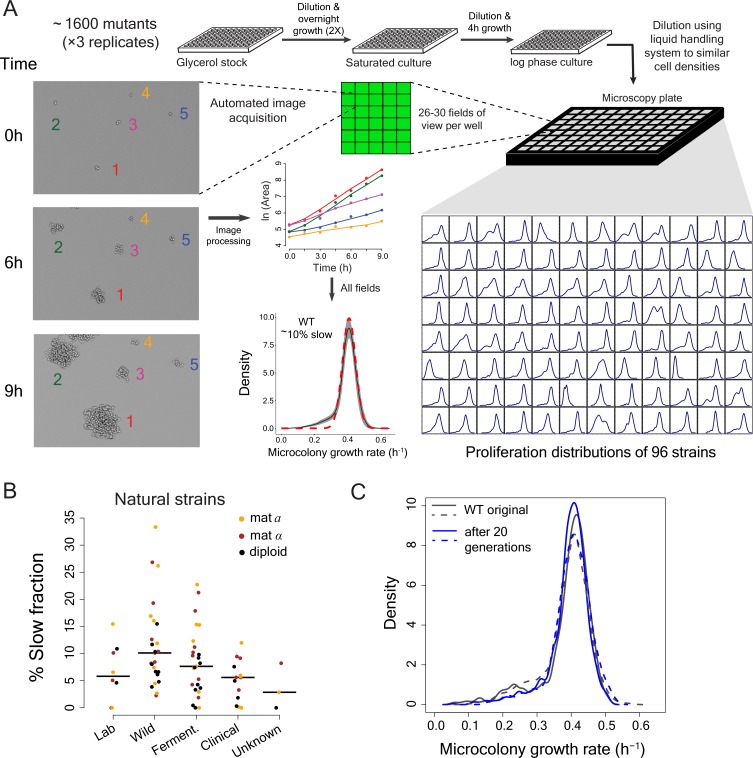
Figure 1. High-throughput analysis of single cell proliferation rate heterogeneity.
(A) High throughput microscopy setup – log phase yeast cells were diluted onto conA coated microscopy plate using Biomek NX liquid handling system to have similar cell density across wells. Cells were observed using an ImageXpress Micro system. Images were processed using custom scripts and data for area of microcolony vs. time were obtained. The points in the area vs. time graph show actual data and the solid lines show lowess fits. Data collected from all fields of view in a well constitute a microcolony proliferation rate distribution for a strain. The common lab yeast strain BY4741 (WT) has ~10% slow proliferating sub-population. The density shows mean density and the shaded areas in grey represent ±1 s.d. value at each point. The dotted red line shows the expected proliferation distribution if it were normally distributed. (B) Natural strains of yeast (Ziv et al., 2013) also have slow proliferating sub-populations. Each point represents data for one strain. Solid lines show median value. (C) WT strain re-created the original proliferation distribution even after 20 generations of growth. The plot shows data from two replicate measurements.

