. 2019 Jan 14;8:e38904. doi: 10.7554/eLife.38904

Figure 2. Single cell proliferation rate distributions for 1500 gene deletions.

(A) Mode growth rate (h−1) and % slow fraction for 1520 deletion strains. The points represent average values across replicates and the bars represent ±1 s.d. values. The colours show classification of mutants into different categories according to change in mode growth rate (see Materials and methods, FDR < 0.1) and change in % slow fraction (FDR < 0.1) compared to the wild-type (WT) strain. The table and pie chart show the number and proportion of strains in each group (colour coded). Replicate data for WT strain are shown by multiple black points. (B) Examples of growth distributions of mutants classified into different groups which are colour coded as in A. The distribution in dark grey shows WT growth distribution. (C) Coefficient of variation (CV) vs. mean growth rate for all strains. WT values are shown in black; mutants of genes that localize to mitochondrial envelope in red. The points represent average values across replicates and the bars represent ±1 s.d. values. (D) % of WT-like cells in all mutants showing variable mutation outcome. It was calculated for all mutants showing significant reduction in mean proliferation rate and had significant proportion of cells growing as fast as the bulk of the WT proliferation distribution (Wilcoxon rank-sum test). (E) Functional class enrichment (GOslim) analysis for different classification groups show significantly enriched functional classes (hypergeometric test, FDR < 0.1). P – Biological Process, F – Molecular Function, C- Cellular Component. Bars show % of genes in a particular group (colour coded) being present in that particular functional class.

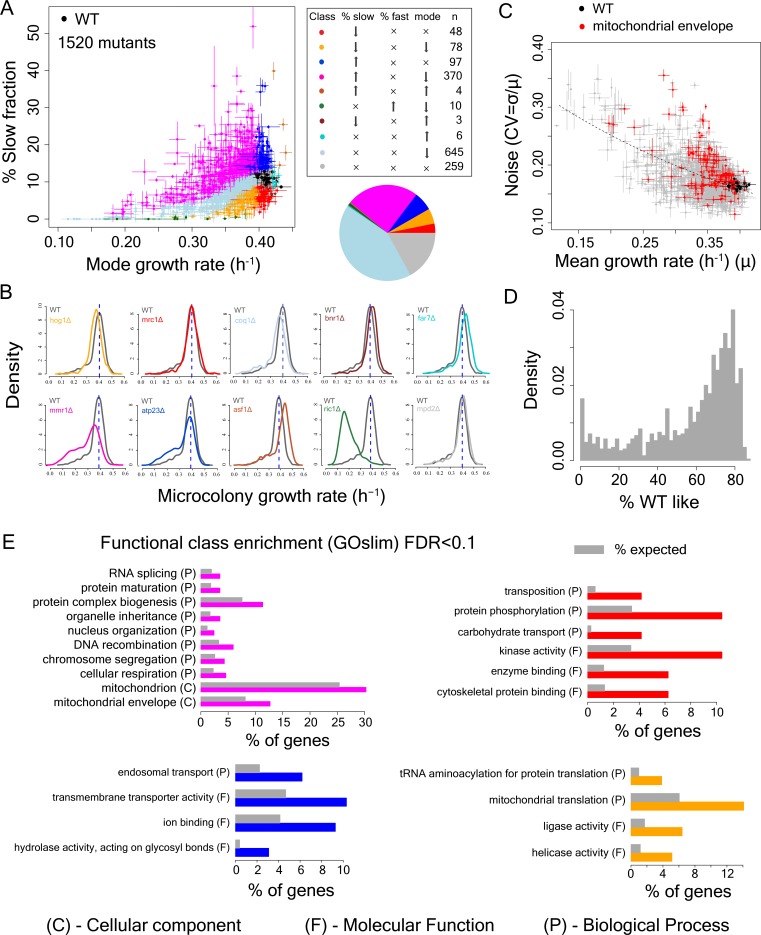
Figure 2—source data 1. Percentage of slow-growing cells in WT and mutant strains.
elife-38904-fig2-data1.xlsx (318.6KB, xlsx)
DOI: 10.7554/eLife.38904.007

Figure 2.

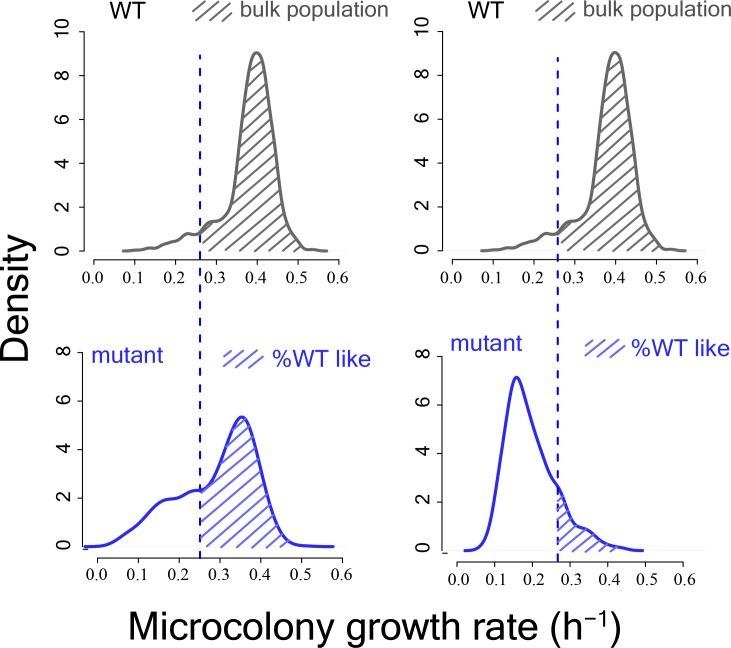
Figure 2—figure supplement 1. Schematic diagram showing calculation of %WT like cells from mutant proliferation distributions.

Figure 2—figure supplement 1.

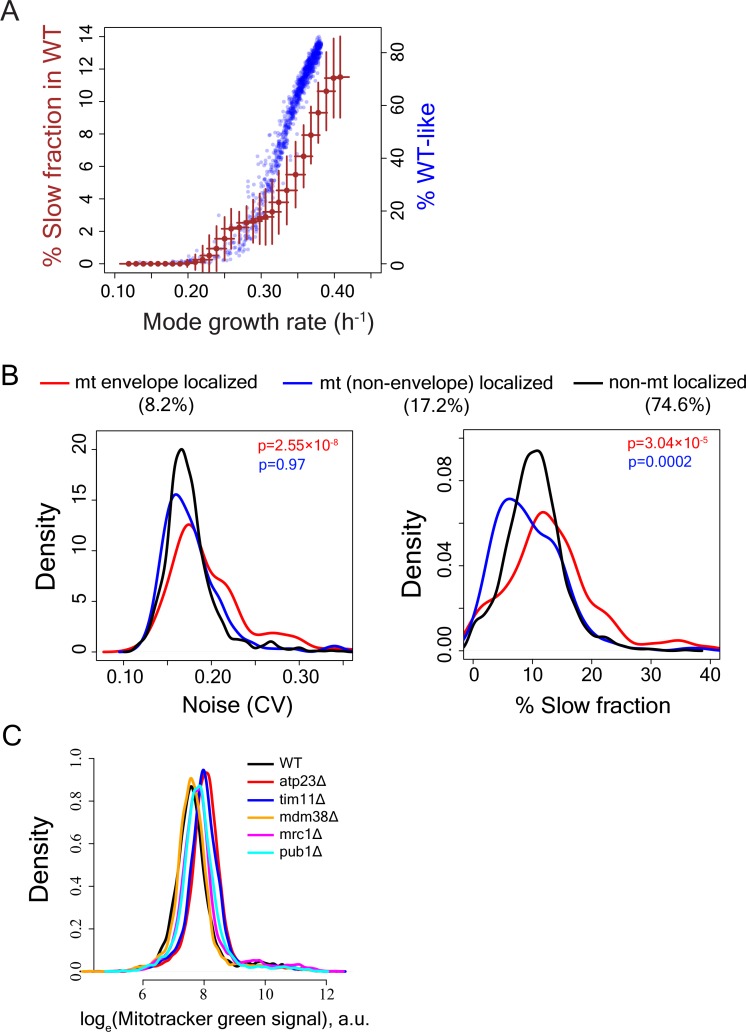
Figure 2—figure supplement 2. Calculation of slow-growing sub-population and functional enrichment analysis.

Figure 2—figure supplement 2.

(A) To test how reduction in mode growth rate without any change in growth rate of slow sub-population might influence our capability to detect slow fraction, the main sub-population of WT strain was computationally moved by reducing mode growth rate in steps of 0.01 h−1 without altering the growth rate of the slow sub-population. This was done for all independent measurements of growth rate distributions for WT. The brown points show average value for all such independent computations and the error bars show ±1 s.d. values from all computations. The blue points show the %WT-like cells vs. mode growth rate (h−1) for mutants exhibiting incomplete penetrance (IP). A mutant was considered to be incompletely penetrant if its proliferation distribution had significant overlap with the bulk of the WT proliferation distribution. (B) Distribution of Noise (Coefficient of variation or CV) (left) and distribution of percentage slow fraction (right) for knock-out of genes that localize to mitochondrial envelope (in red), genes that localize to mitochondria (excluding mitochondrial envelope) (blue) and rest of the genes (black) in our dataset. P-value in red is from statistical test between red and black distributions and P-value in blue is from statistical test between blue and black distributions (Mann-Whitney U test). (C) Mitochondrial amount of WT and mutant strains as measured by Mitotracker green intensity using flow cytometry.