. 2019 Jan 14;8:e38904. doi: 10.7554/eLife.38904

Figure 3. Variation in mitochondria potential across single cells underlies proliferation heterogeneity.

(A) TMRE stain intensity (log transformed) measured by flow cytometry in WT and deletion mutants. (B) TMRE intensity in WT and natural isolates of S. cerevisiae strains. (C) WT cells were sorted by TMRE signal intensity into four bins HI, M1, M2 and LO with gates as shown (~5% of the population sorted in each bin) and growth rate distributions were measured using high throughput microscopy setup. HI bin was enriched for slow growing cells. (D) % of respiration deficient cells in each bin from WT strain. The columns represent the average values from 12 independent experiments and the bars show ±1 s.d. values. (E) Percentage of respiration deficient cells in WT and mutant strains is positively correlated with the percentage of slow growing cells. The blue dotted line represents y = x line. The error bars represent ±1 s.d. measured from at least two biological replicates for each strain. (F) Percentage of respiration deficient cells in UCC strains (Dimitrov et al., 2009) is strongly positively correlated with the percentage of slow growing cells. The blue dotted line represents y = x line. The error bars represent ±1 s.d. measured from at least two biological replicates for each strain.
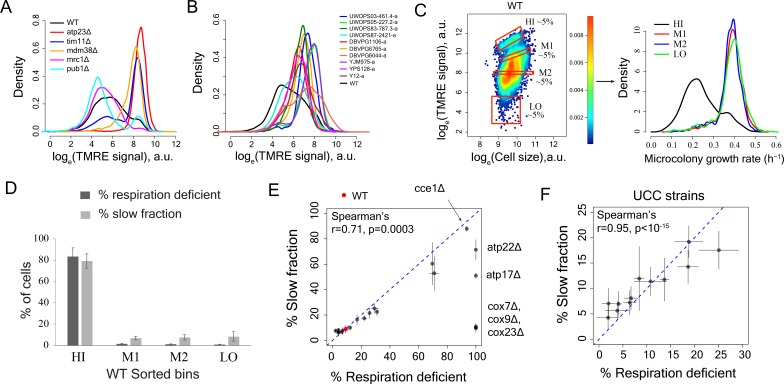
Figure 3—source data 1. TMRE intensity distribution in WT and mutant strains.
DOI: 10.7554/eLife.38904.011

Figure 3.

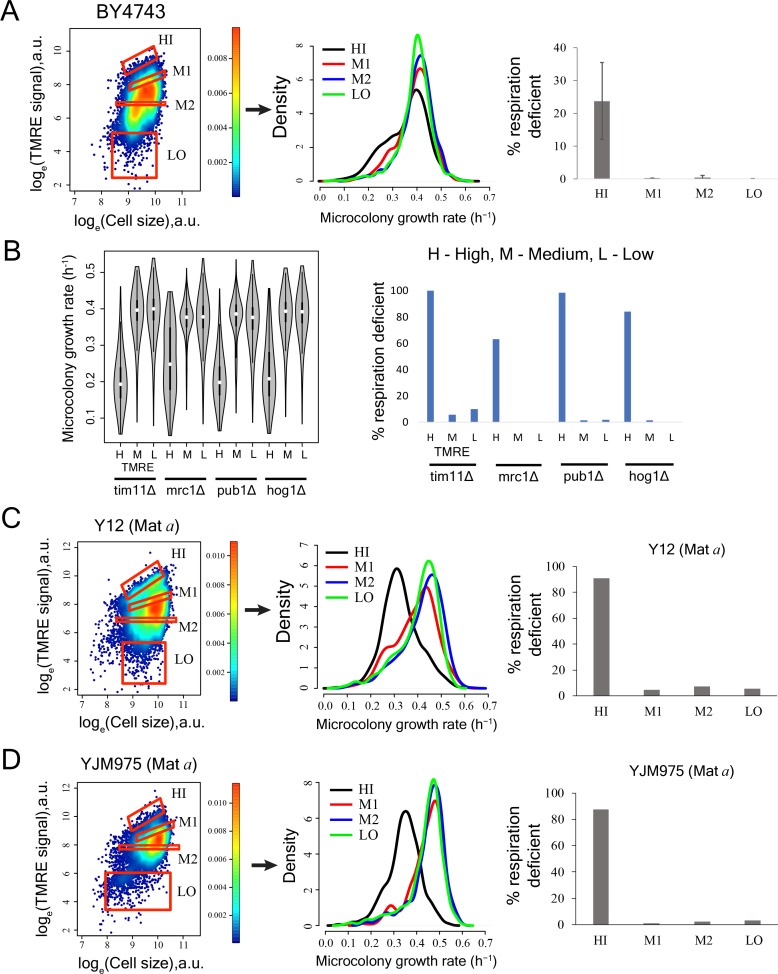
Figure 3—figure supplement 1. Cells with high mitochondrial membrane potential in mutant yeast strains, natural yeast isolates and diploid strain BY4743 show enrichment for slow-growing and respiration deficient cells.

Figure 3—figure supplement 1.

(A) TMRE staining and sorting of BY4743 diploid strain. Bin HI showed higher percentage of slow cells in high throughput microscopy assay. Bin HI showed enrichment for respiration deficient cells. The results are from two independent experiments. (B) Sorting of mutant strains based on TMRE intensity and subsequent growth rate measurements showed slower growth in high TMRE cells (left). Cells with high TMRE signal were also enriched for respiration deficient cells in mutants (right). (C) Cells showing high TMRE intensity in Y12 strain (Mat a derivative) were enriched for slow growing fraction and respiration deficient cells. (D) Cells showing high TMRE intensity in YJM975 strain (Mat a derivative) were enriched for slow growing fraction and respiration deficient cells.
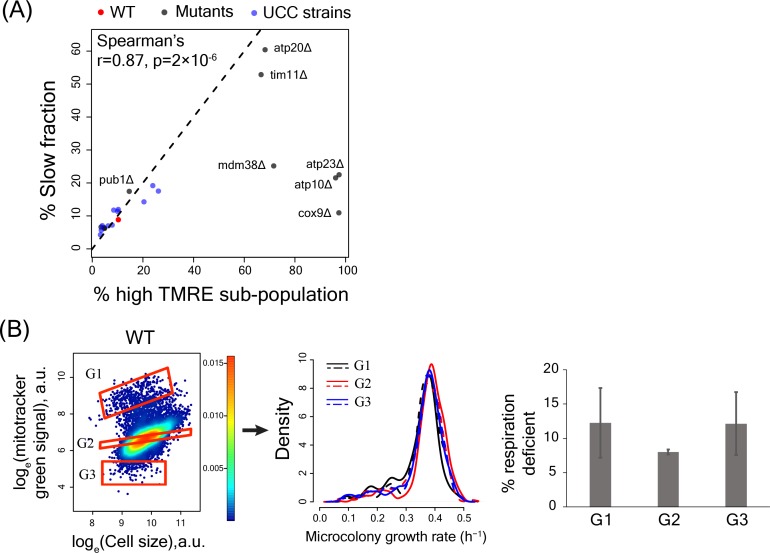
Figure 3—figure supplement 2. High TMRE signal but not mitotracker green signal predicts slow-growing subpopulation.

Figure 3—figure supplement 2.

(A) Percentage of slowly proliferating sub-population was significantly correlated with percentage of high TMRE cells across WT, deletion mutants and UCC strains. (B) Sorting WT cells by Mitotracker green intensity did not enrich for slow growth or percentage of respiration deficient cells in any sorted bin.