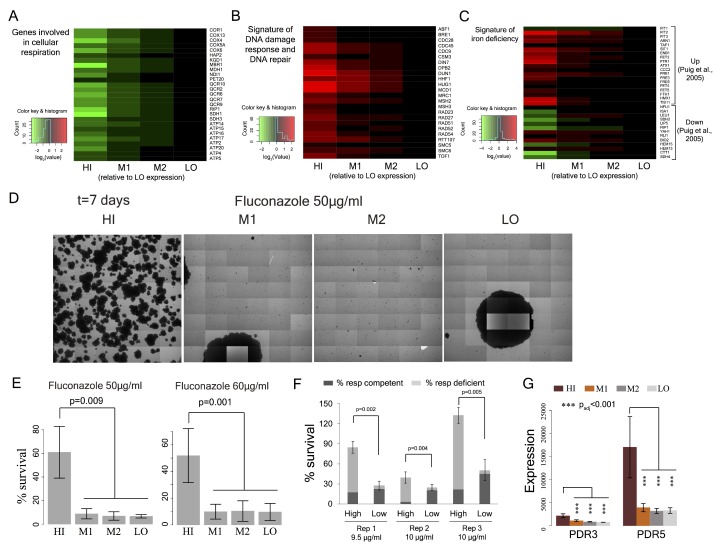
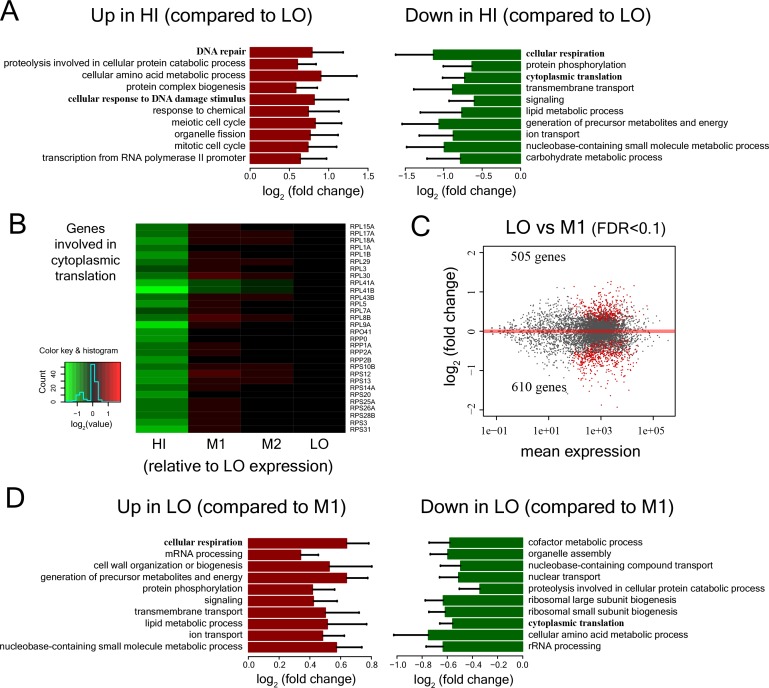
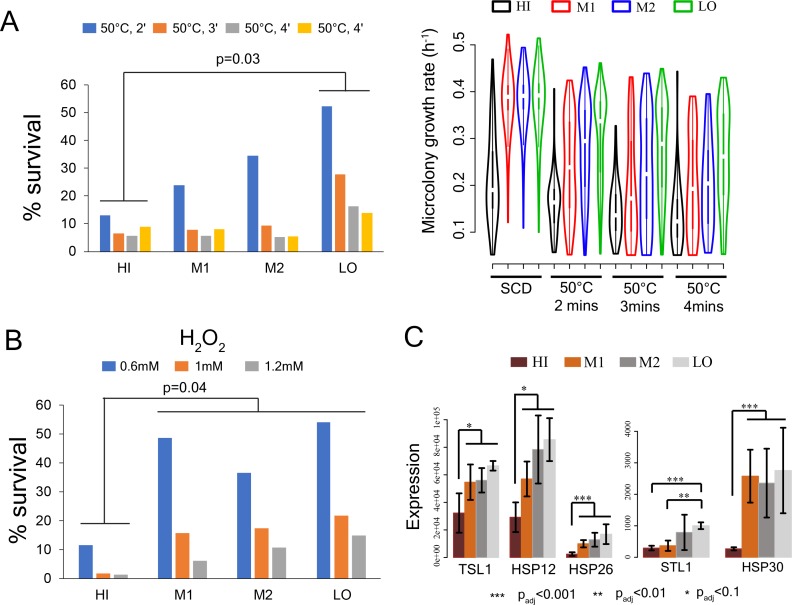
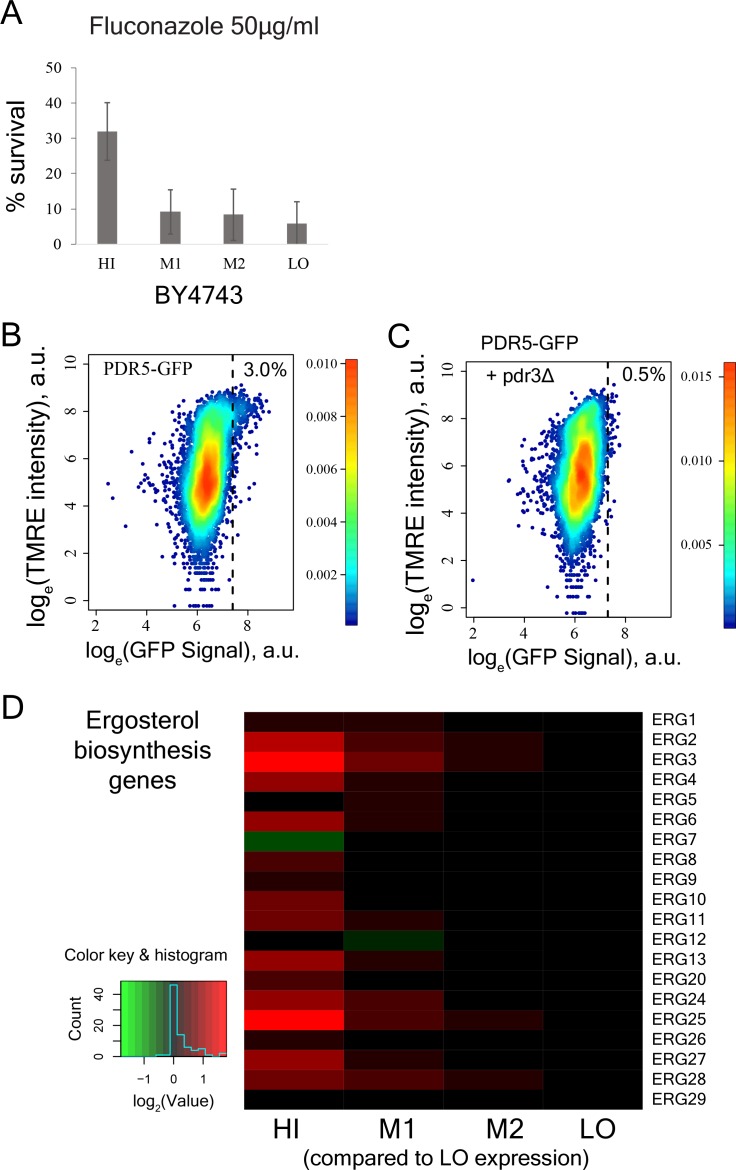
Figure 5. Cell-to-cell variation in mitochondria potential predicts single cell drug resistance.
(A) Heatmap of expression of respiration genes in cells sorted by their TMRE signal intensity (bins HI-LO). (B) Heatmap of expression of DNA damage response and DNA repair genes. (C) Heatmap of expression of genes associated with iron deficiency (Puig et al., 2005; Veatch et al., 2009). Data are from four independent experiments. (D) Sorted bins from WT cells were grown in a commonly used antifungal drug fluconazole and were observed under microscope for growth over 7 days. The images show growth of cells in bins HI, M1, M2 and LO in 50 μg/ml of fluconazole after 7 days. (E) Cells of HI bin showed significantly higher survival compared to other bins in both 50 μg/ml (three independent experiments) and 60 μg/ml fluconazole (four independent experiments). Cells were grown in liquid medium supplemented with fluconazole on microscopy plates and viability was calculated from microscopic observations over 7 days. Colonies showing growth rate above 0.02 h−1 after first time point were considered to be survivors. Error bars show ±1 s.d. values. (F) Percentage survival of high and low TMRE cells on fluconazole plates. High TMRE cells showed higher survival than low TMRE cells (Mann-Whitney U test). A substantial fraction of surviving high TMRE cells were respiration competent. The error bars represent ±1 s.d. values from six technical replicates for each bin. X-axis shows fluconazole concentrations used from three independent experiments. (G) From RNA sequencing data, cells from HI bin showed significantly higher expression of multidrug transporter PDR5 gene and its transcriptional activator PDR3 compared to cells from bins M1, M2 and LO. Results are from four independent experiments.

