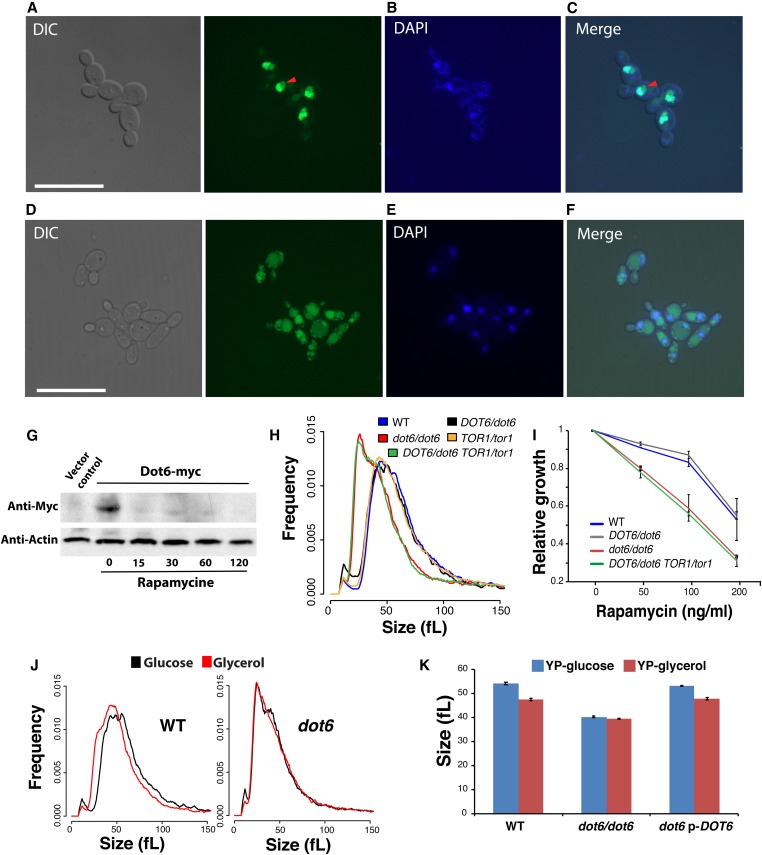
Figure 4.
Dot6 localization is regulated by the TOR signaling pathway. (A–F) Dot6-GFP fluorescence was visualized using confocal microscopy in cells treated (D–F) or not (A–C) with the TOR pathway inhibitor, rapamycin. Exponentially grown cells in SC medium were treated with 100 ng/ml rapamycin for 1 hr. Nuclear and mitochondrial DNA were demarcated by DAPI staining (B and E). Red arrows indicate Dot6-GFP florescence in nucleolar regions. Bar, 5 µm. (G) Level of Dot6 in exponentially grown cells in SC medium treated or not with 100 ng/ml rapamycin for 15, 30, 60, and 120 min. Vector control corresponds to the untagged strain. (H and I) DOT6 and TOR1 genetic interaction for cell size and growth in the presence of rapamycin based on complex haploinsufficiency concept. (H) Size distributions of the WT (SN250), the heterozygous (DOT6/dot6), and homozygous (dot6/dot6) dot6 mutants, the heterozygous TOR1/tor1 strain and the double heterozygous mutant TOR1/tor1 DOT6/dot6. (I) DOT6 is epistatic to TOR1 with respect to their sensitivity toward rapamycin. Strains were grown on in SC medium at 30° for 24 hr. Relative growth was calculated as fraction of OD600 of rapamycin-treated cells relatively to the nontreated controls. Results are the mean of three replicates. (J and K) Dot6 is required for carbon-source modulation of cell size. (J) Cell size distribution of the WT and dot6 mutant strains grown in medium with either glucose or glycerol as the sole source of carbon. (K) Median size of the WT (SFY87), dot6 mutant and the revertant strains growing in synthetic glucose or glycerol medium. Results are the mean of three independent replicates.

