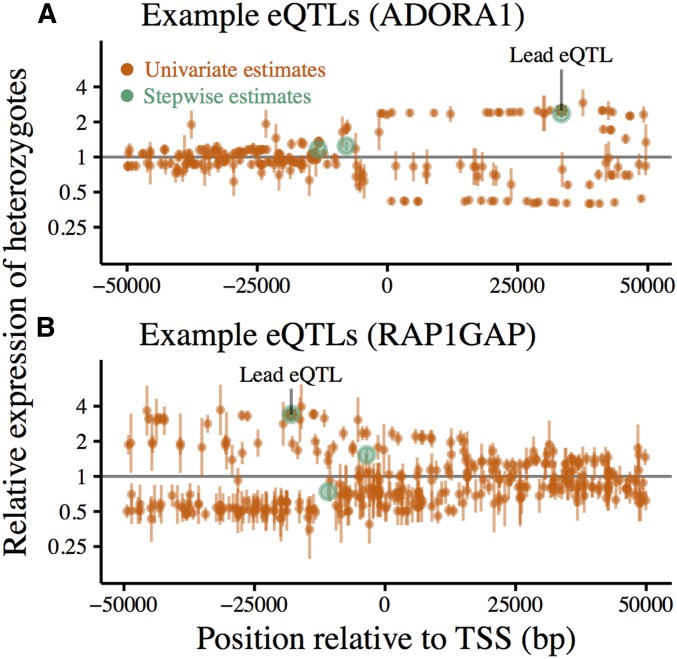
Figure 3.
cis-eQTLs called using forward-stepwise mapping from whole-blood RNA sequencing in 922 European individuals. (A) eQTL mapping for ADORA1. (B) eQTL mapping for RAP1GAP. Effect sizes are polarized relative to the ancestral allele. Stepwise effect size estimates (green) are compared to those obtained by testing each SNP independently (orange) at two example loci. Vertical bars mark ± 2 SE around the estimated effect size for each SNP. Lead eQTLs (smallest P-value) from independent testing are marked with asterisks.

