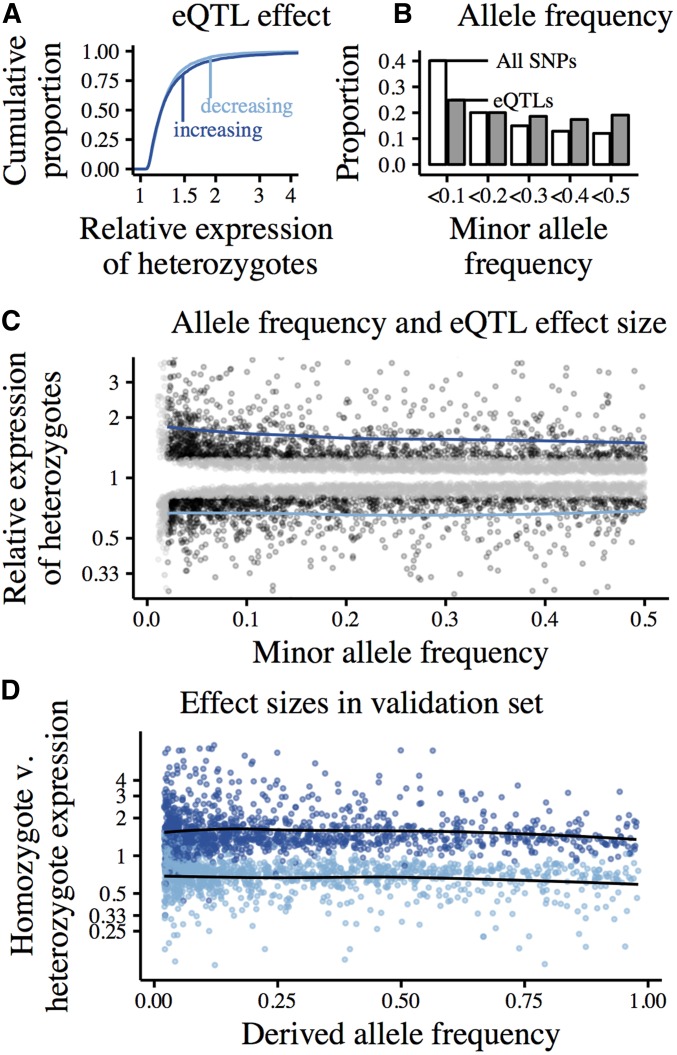
Figure 4.
cis-eQTLs called using forward-stepwise mapping in 100 kb windows centered on the TSS of autosomal, protein-coding genes. Data from whole-blood RNA sequencing in 922 European individuals (DGN). Effect sizes polarized relative to the ancestral allele. (A) Cumulative distributions of estimated eQTL effect sizes, represented as the ratio of eQTL-heterozygotes to eQTL-homozygotes. Expression-increasing eQTLs (derived allele increases expression) shown in dark blue, expression-decreasing eQTLs in light blue. (B) Allele frequency spectrum of eQTLs (gray) relative to the background of all tested SNPs (white) (C) Joint distribution of eQTL MAF and estimated effect size. Black points show eQTLs with effect sizes that we are powered to detect at all frequencies (estimated effect greater than the minimum effect of eQTLs with MAF<0.02), gray points show eQTLs that are especially rare (MAF<0.02) and/or have effect sizes that we are powered to detect only at higher frequencies. Blue lines show loess-fits of MAF vs. effect size for well-powered expression-increasing and -decreasing eQTLs (black points). (D) eQTLs called in an ascertainment set of 800 individuals, effect sizes estimated in validation set of 122 individuals. Only well-powered eQTLs across allele frequencies and with MAF>0.02 are plotted. Points colored by the direction of effect in the ascertainment set; expression-increasing eQTLs in dark blue, expression-decreasing eQTLs in light blue. Loess-fits of MAF vs. effect size for expression-increasing and -decreasing eQTLs in black.

