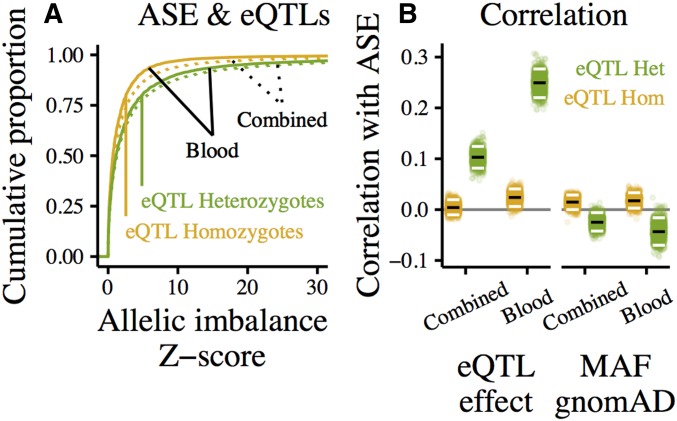
Figure 5.
eQTL effects reflected in ASE at eGenes. “Blood” shows ASE in whole blood, “Combined” shows combined-tissue ASE, measured by summing reads spanning an ASE site in the same individual across tissues. (A) Cumulative distributions of ASE measured in whole blood (solid) and combined-tissue ASE (dotted), separated into eQTL-heterozygotes (green), and -homozygotes (homozygous for all called eQTLs, yellow). (B) Rank correlation between allelic imbalance and eQTL effect (left) or minor allele frequency in gnomAD (right). The effect/MAF of the most significant heterozygous eQTL (or, for eQTL-homozygotes, the most significant eQTL) was used. To determine the robustness of these correlations, each point shows the rank correlation in one of 1000 samples generated by bootstrapping over genes. Median correlations of bootstrap samples marked in black, 95% quantiles in white.

