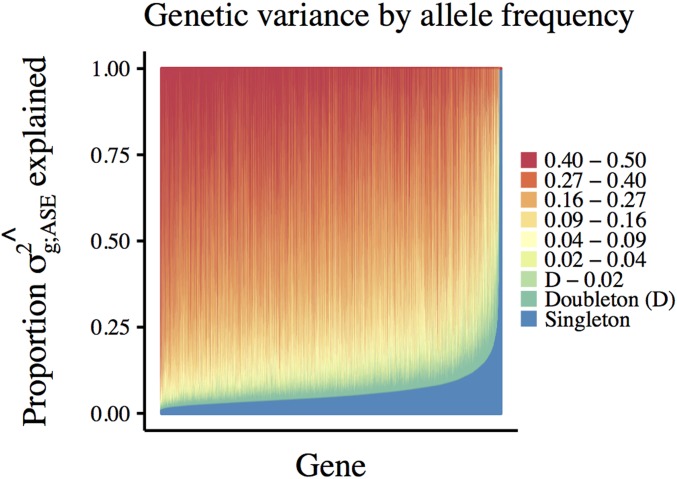
Figure 8.
Partitioning the genetic variance of allelic imbalance by allele frequency. For each gene, we combine the average heterozygosity (2 pq) and number of segregating sites in each allele frequency bin with the estimated average effect size of variants in that bin to calculate the total genetic variance of allelic imbalance captured by our ASE-model We then calculate the proportion of explained by each allele frequency bin (variants binned by minor allele frequency in GTEx). Each vertical bar represents a single gene for which we measured ASE, colors represent the proportion of genetic variance attributed to variants in each allele frequency bin.

