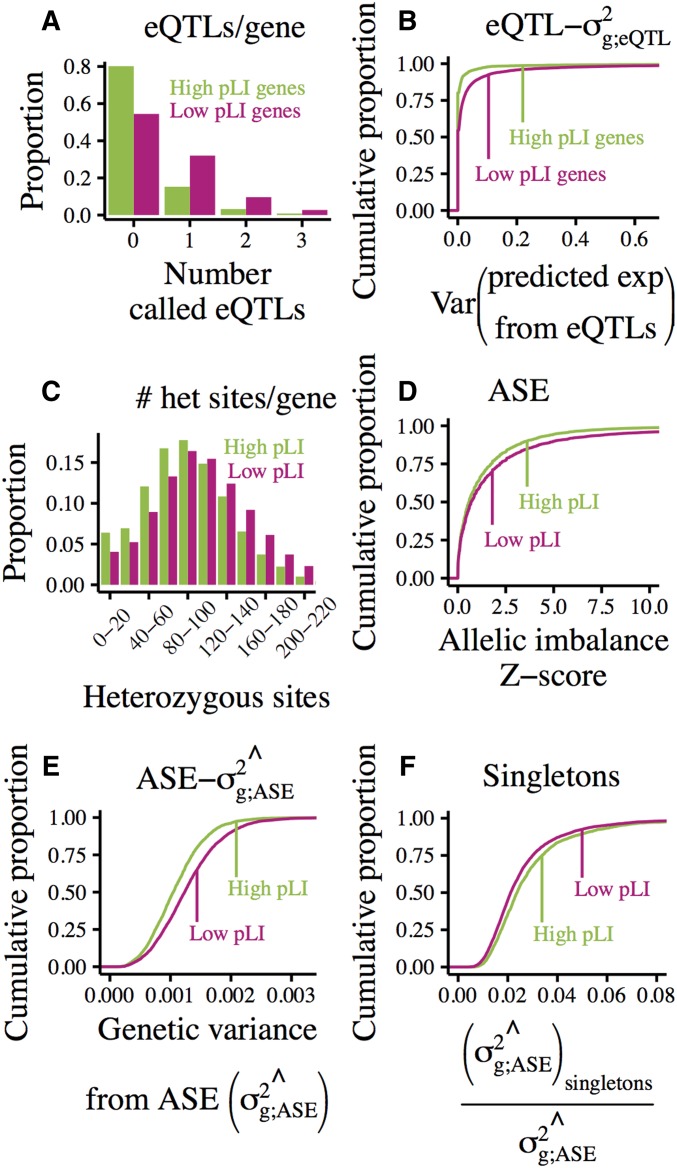
Figure 9.
Regulatory genetic variation across gene sets with varying levels of constraint on gene expression as predicted by pLI class. (A) Histogram of the number of cis-eQTLs called per gene by pLI class. (B) Cumulative distributions of eQTL-estimated genetic variance by pLI class. For each gene in each individual, expression levels were predicted using genotypes and effect size estimates of called eQTLs. Genetic variance was then estimated as the variance of eQTL-predicted expression levels across individuals. (C) Histogram of the number of cis-heterozygous sites (per individual-gene pair) within 50 kb of the TSS by pLI class. (D) Cumulative distributions of allelic imbalance, measured in whole blood, by pLI class. (E) Cumulative distributions of the genetic variance of allelic imbalance captured by our model, estimated using combined-tissue ASE and allele frequencies binned according to GTEx, by pLI class. (F) Cumulative distributions of the proportion of the genetic variance of ASE attributable to singletons by pLI class.

